All your investments in one place, not all over the place.
Track shares and ETFs from over 40 exchanges worldwide, plus Canadian & US mutual funds. You can also track cash and over 100 currencies, as well as unlisted investments such as fixed interest and investment properties.
Sign up for free
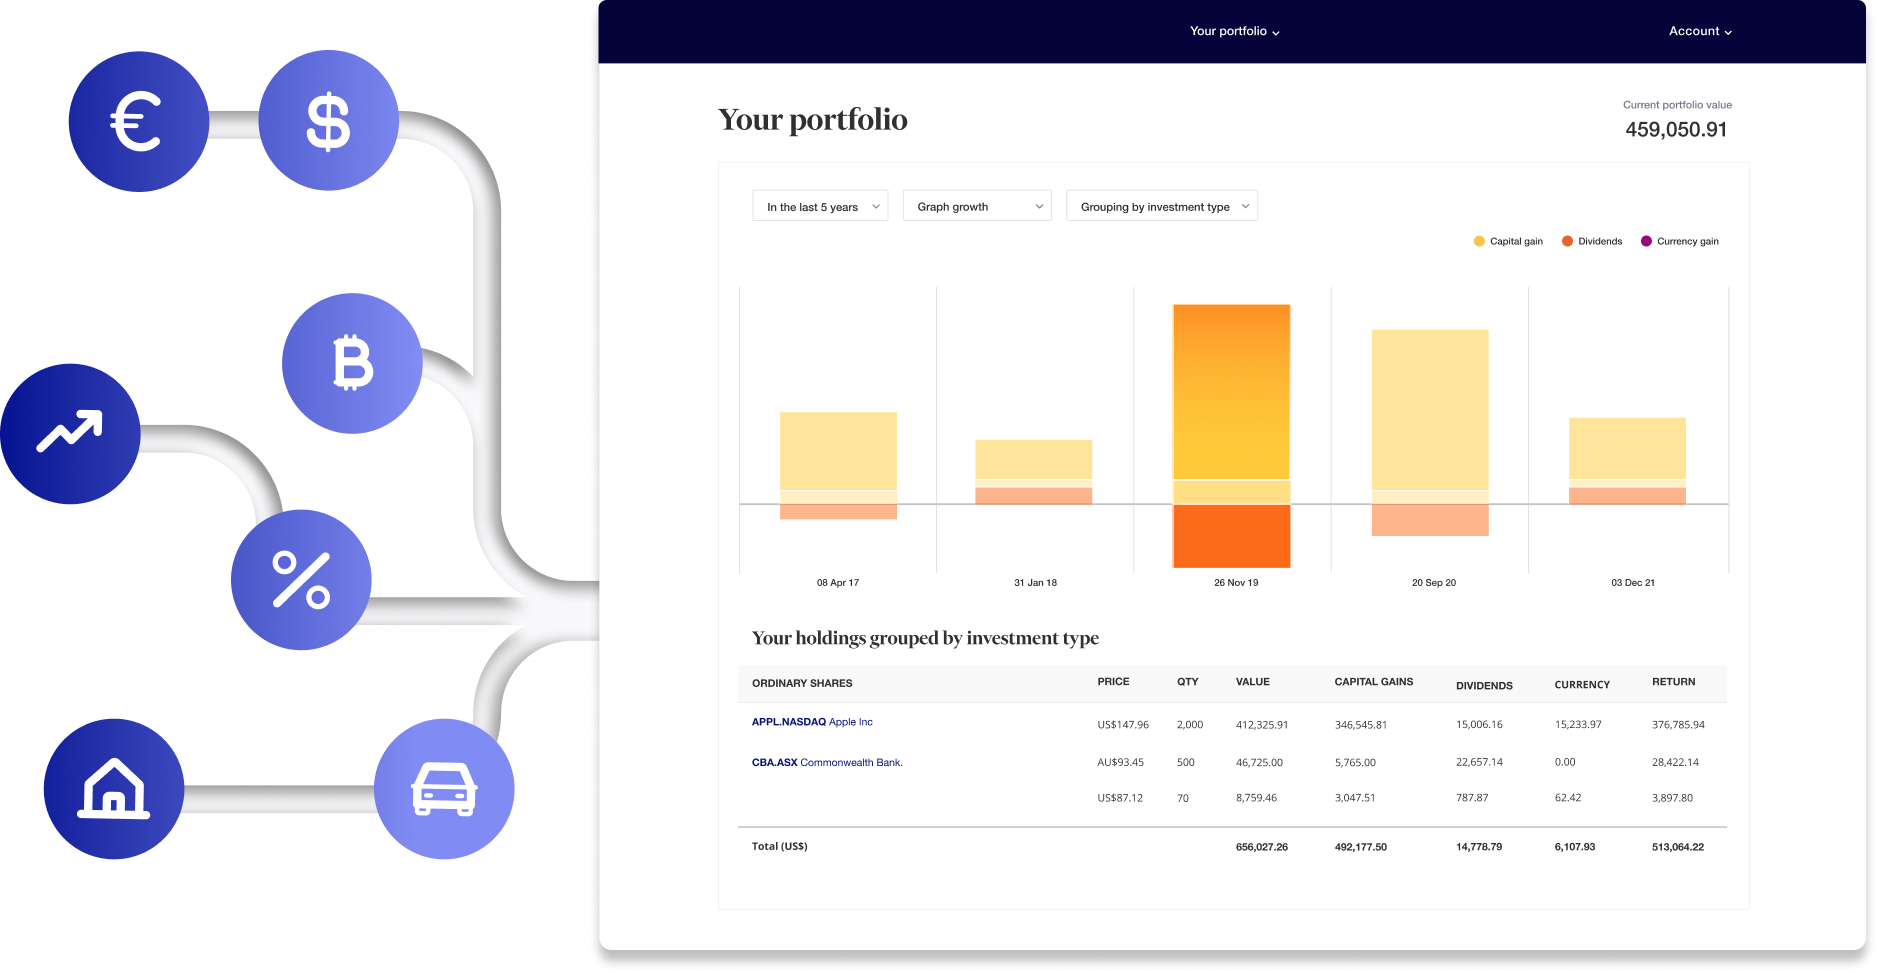
Know your true performance
See the true performance of all your holdings – no matter where they live.
Track multiple asset classes
Track private equity, alternatives, real estate and more – all in a single place.
Make insight-driven decisions
Drive financial decisions knowing your end-of-day dynamic wealth position.
Swap your investment spreadsheet for Sharesight
Managing your investment portfolio used to involve hours spent manually updating a spreadsheet. Online investment portfolio tools like Sharesight make it easy.
Powerful investment performance & tax reports
Track investment performance over any period
Calculate the impact of capital gains, dividends and currency fluctuations on your portfolio with the Performance Report. Break down your performance along a range of preset and custom dimensions including country, market, industry and more. Compare how different investments perform within your portfolio and add custom labels to further filter the report.

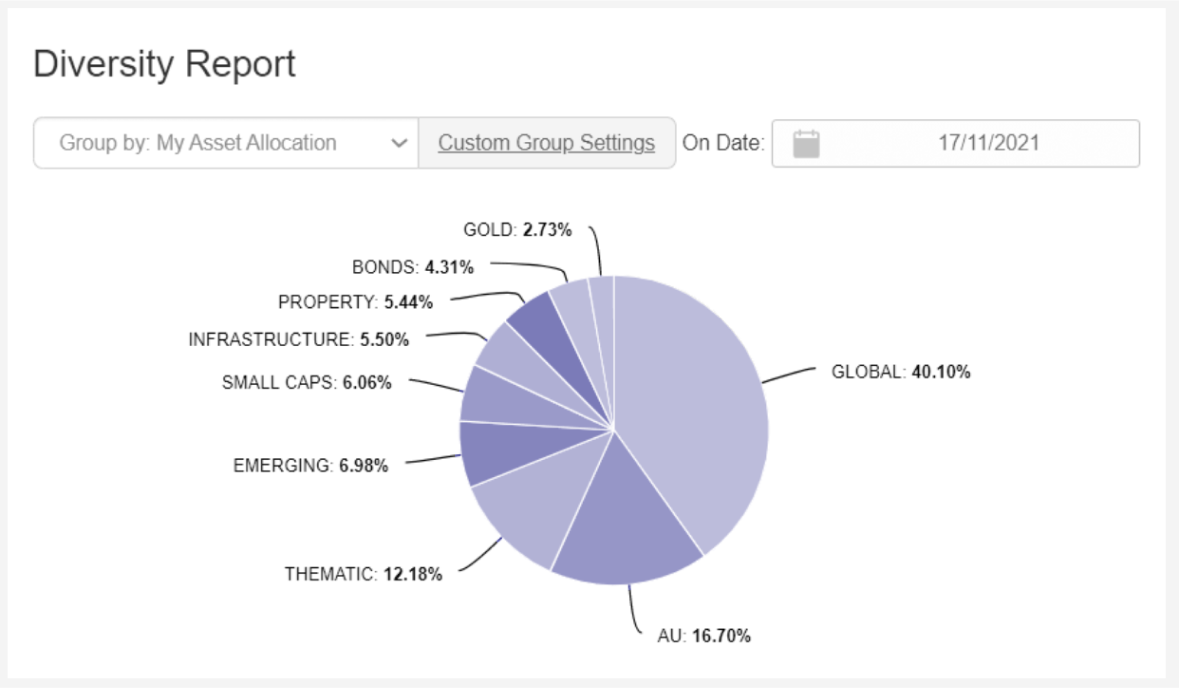
Visualise your portfolio diversity
Track your asset allocation and calculate your portfolio diversity across FACTSET investment classifications or your own groupings with the Diversity Report. This makes it easy to rebalance your portfolio to your target asset allocation.
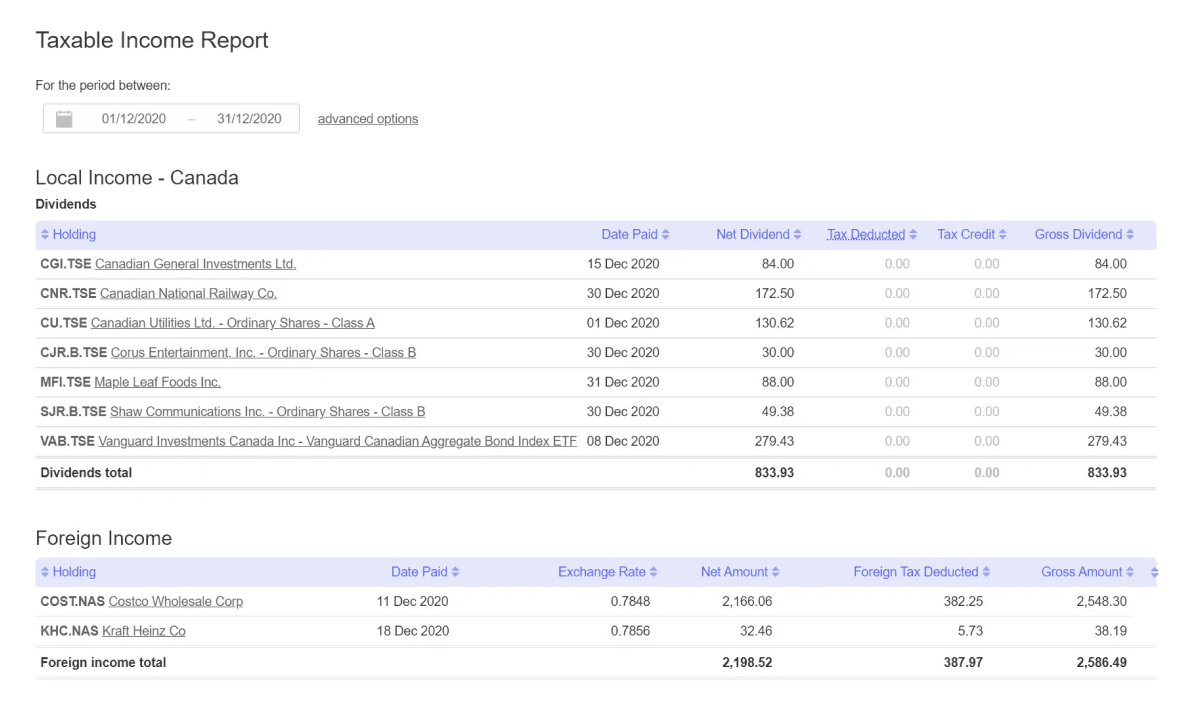
Track all your investment income
Report your investment income from dividends, distributions and interest payments with the Taxable Income Report. With historical dividend data going back over 20 years, the report breaks up local (Canadian) and foreign income and can be run at any time, over any time period to help you complete your taxes.
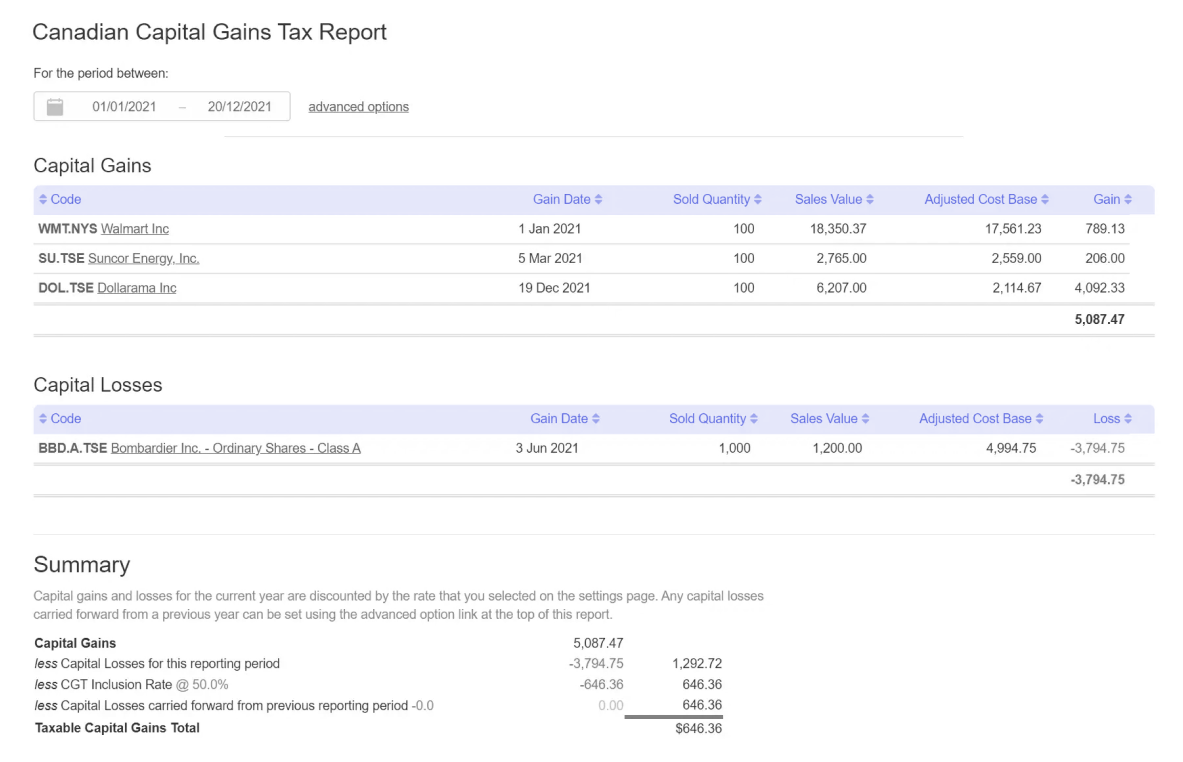
Calculate your capital gains tax
Calculate your capital gains tax on investments with the Capital Gains Tax Report, using the ‘Adjusted Cost Base’ sale allocation method as per Canada Revenue Agency (CRA) rules.
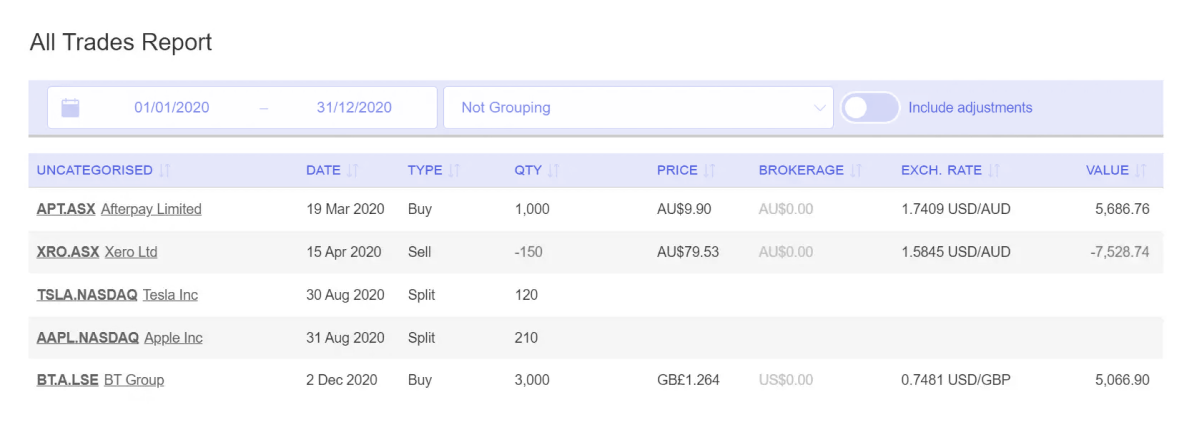
Report on all trades made
Need a complete view of all the trades you made during the financial year? View your trading history using the All Trades Report. Export your investment activity and share it with your accountant or financial advisor to make tax time a breeze.
Built for Canadian investors
Investors just like you use Sharesight to get all the info they need to report investment income to file tax returns with the CRA.
Tax residency
Set your portfolio currency to Canadian dollars and automatically track currency impacts for any non-Canadian stocks.
CRA tax entities
Choose your portfolio type from a range of CRA tax entities - Non-Registered, RRSP, RRIF, or TFSA.
CA tax year
Set your tax year to match the Canadian financial year ending 31 December, to automate your tax reporting.
Upload your holdings, and we’ll take it from there
Upload your holdings
Sign up and add your holdings – either by connecting to your broker, uploading a spreadsheet, or manually entering your trading history or opening balance.
Get automatic updates
Sit back and watch as corporate action data (such as dividends and stock splits) are automatically incorporated – going back up to 20 years, and ongoing.
Gain powerful insights
Graph your performance, benchmark your portfolio against market indexes, see your asset allocation, and visualise your portfolio diversity by market, sector, country, and more.
Don't just take our word for it
Over 400,000+ investors track their investments with Sharesight. Here’s what a few of them have to say:
400
k+
700
k+
200
Plans & Pricing
Start by tracking up to 10 holdings for free! Then upgrade to a premium plan at any time to track additional holdings or portfolios, and unlock advanced features.
Free
$0
Forever
Starter
$6
CAD per month
billed annually
$12 CAD billed monthly
Investor
$15.50
CAD per month
billed annually
$31 CAD billed monthly
Expert
$19.50
CAD per month
billed annually
$39 CAD billed monthly
Featured in

Get 50% off an annual premium plan when you upgrade within 60 days of signing-up. Open to new or existing Free plan users only. May not be combined with other offers. The 50% discount applies when comparing our standard monthly subscription fee against the annual pre-paid offer subscription fee.