Calculate portfolio risk with Sharesight
The drawdown risk report calculates the maximum drawdown of your investments, enabling you to pinpoint risky assets and adjust your portfolio to better align with your risk tolerance.
Sign up for free

How maximum drawdown calculates risk
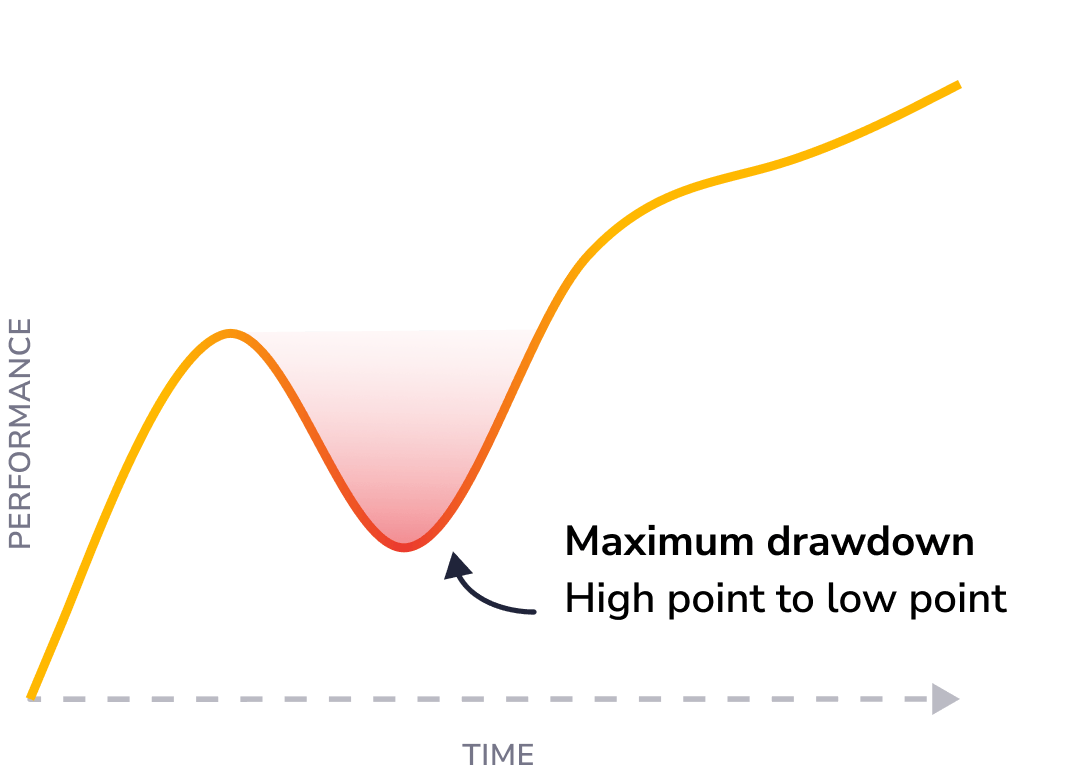
Maximum drawdown (MDD) measures an investment’s largest observed loss, from peak to trough, with significant declines often seen in periods of high volatility. This form of downside risk analysis is an effective way to compare the relative riskiness of one stock to another.

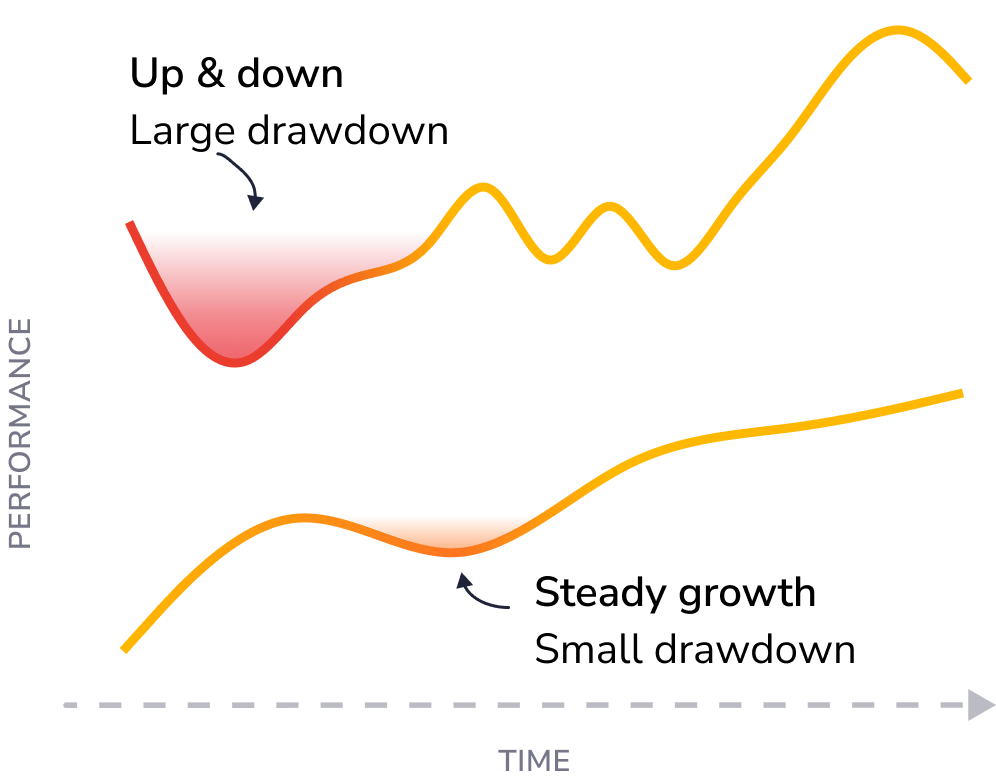
How drawdown reveals downside risk
Two assets might produce similar returns, but their risk profiles can differ greatly — one might experience frequent, small fluctuations, while the other suffers a massive crash. Maximum drawdown (MDD) captures this difference by measuring an investment’s largest observed loss, from peak to trough, with significant declines often signalling high volatility.

Automatically calculate and compare risk
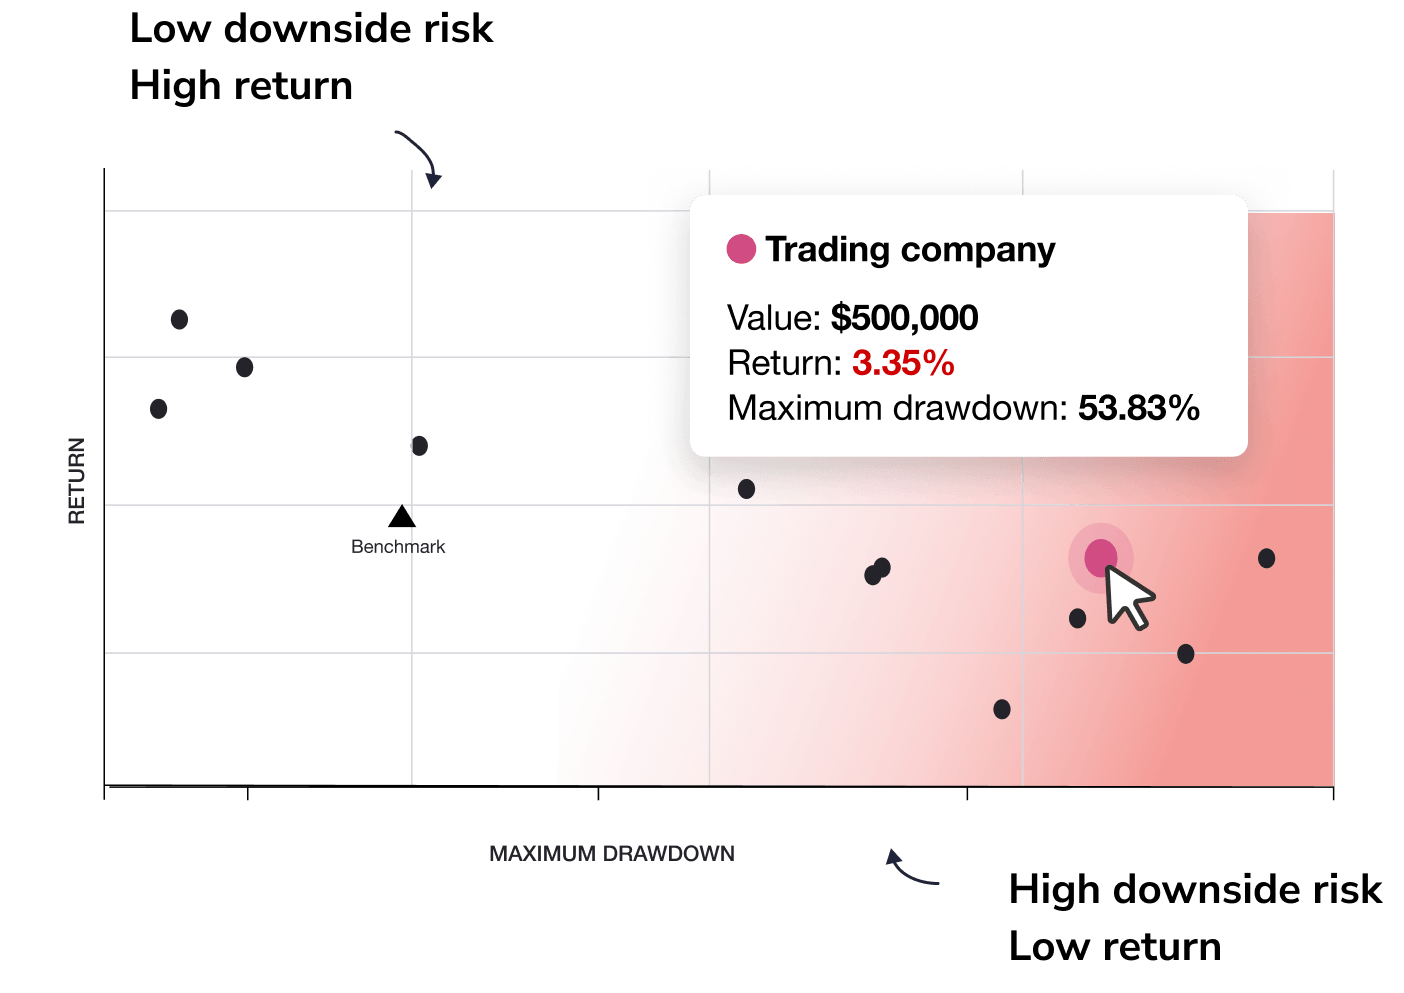
Sharesight automatically calculates the MDD of all your investments and compares them against return. By identifying stocks with high drawdown and low returns, you can immediately flag stocks with poor risk-adjusted performance.

Benchmark your portfolio against other funds & ETFs
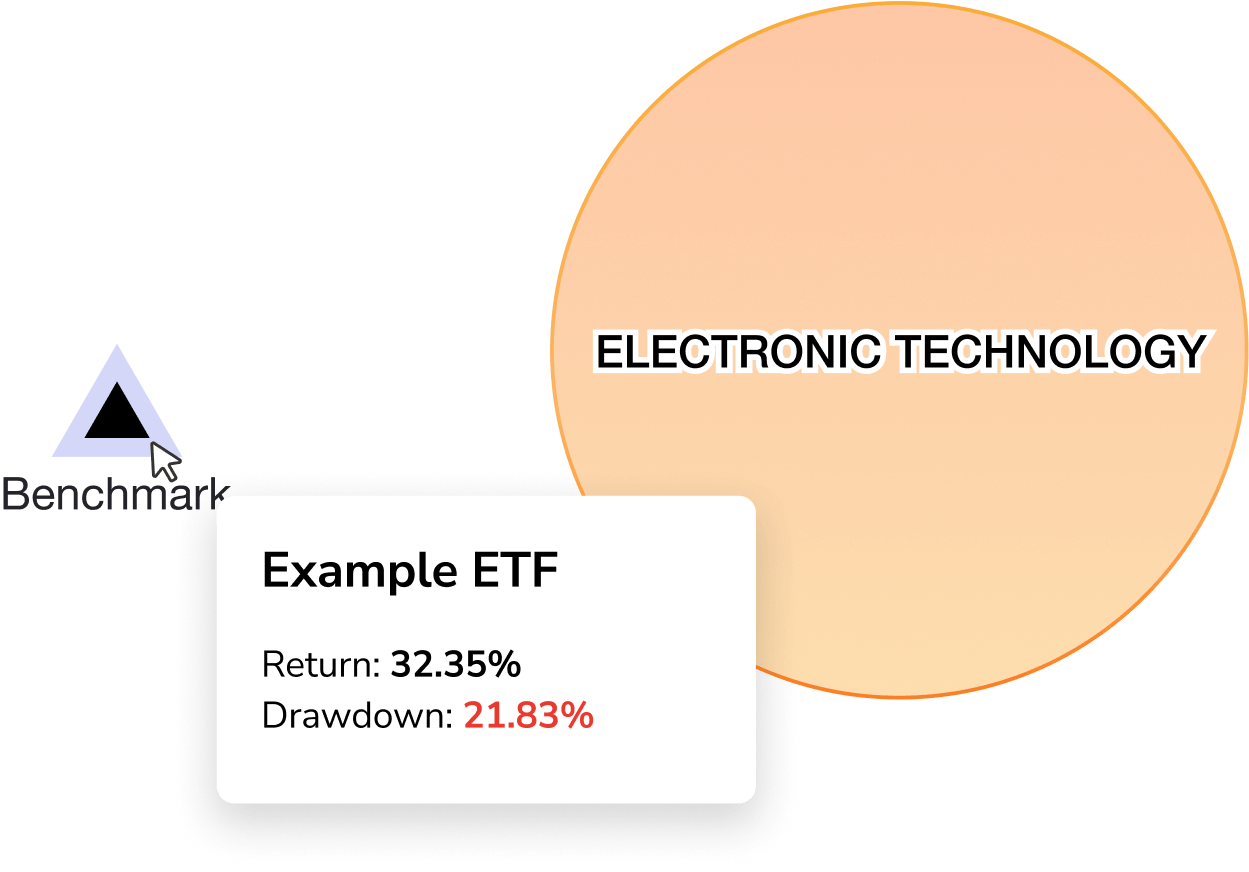
Benchmarking your investments against an ETF reveals how your individual assets or portfolio are performing compared to the broader market. It also helps you assess relative risk and returns, refine your investing strategy and evaluate your portfolio’s overall performance.
Sign up for free

See how the risk report works in Sharesight
Don't just take our word for it
Over 500,000+ investors track their investments with Sharesight. Here’s what a few of them have to say: