Why accurate performance measurement matters
It’s not uncommon to see stock market performance measurement being described inaccurately in the press. But an article in today’s (23/11/11) Financial Review in the Portfolio section entitled Cult of Equity is losing its Followers by John McDuling is one of the more confused I have seen. Here are the opening paragraphs:
To say that the past two decades have been kind to investors in equities is an understatement.
Between October 1991 and October 2011, Australian shares returned investors 433 percent, including dividends, or 22 per cent per annum.
That is way ahead of more defensive assets such as cash or bonds, according to analysis by Commsec’s Craig James.
He says if $100,000 had been invested in stocks 20 years ago it would have been worth $804000 at the start of this year. That same $100,000 would have appreciated to just less than $305,000 in cash.
The article basically goes on to say that returns are unlikely to be as good in the next 20 years. Well, yes, I can almost guarantee they won’t be 22% p.a. But they haven’t been 22% over the last 20 years either.
The problem is that the return presented of 433 percent return over twenty years is not 22 percent per annum using compounded growth. The author has simply divided 433%/20 years = 21.6% which is the simple growth rate (similar to the simple growth in Sharesight) but it is highly misleading in this context. Using compound growth, which allows you to compare it to the way other investments are presented, the annual return is 8.7% , a far more reasonable number and actually slightly below long term equity returns. 100K compounded at 22% over 20 years would be $5,336,000! If you are Warren Buffett this sort of return is possible but it is certainly far higher than the overall market in the last 20 years.
A long run figure of 8.7%, however is perhaps not so unreasonable over a long period. The Future Fund has a target return of inflation + 5%. With inflation RBA inflation goals of 2 to 3% this implies 7 to 8% annual growth over the long term. A bit lower than than the last 20 years but no drastically so.
Why does all this matter? Well all the current crop of articles with this theme (and I have seen many as the market has declined) result in investors potentially underestimating the growth potential of the market relative to its history and moving out of equities at precisely the wrong time. It could prove to be a very expensive decision for investors. This is why we are so passionate here at Sharesight about investors understanding their true return. We think it’s critical to successful portfolio management
It’s important to know your returns and set some realistic expectations about future growth. With high single digit growth rates the magic of compounding will see your investments grow very nicely indeed if you are prepared to give them the time to deliver.
Update: 2:25pm
In the online version of their article the Fin have corrected the calculation and have now put 8.7% as the annualised return into the story. Obviously someone else has pointed out the error but the story makes even less sense now!
This information is not a recommendation nor a statement of opinion. You should consult an independent financial adviser before making any decisions with respect to your shares in relation to the information that is presented in this article.

Sharesight product updates – February 2026
This month's key focus was on the rollout of the new Investments tab to all users, along with various enhancements across web and mobile.

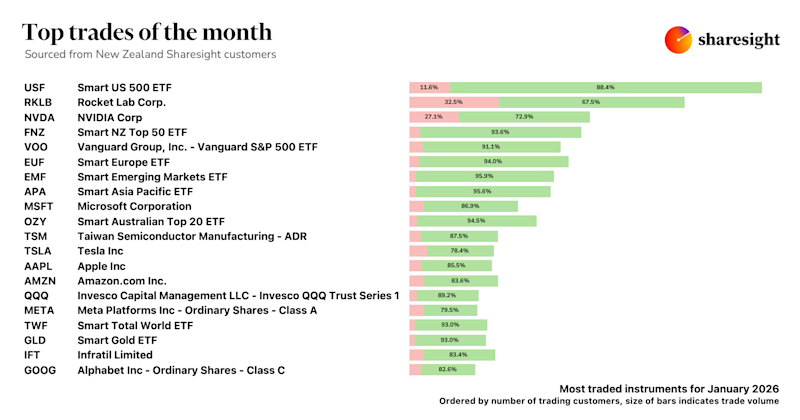
Top trades by New Zealand Sharesight users — January 2026
Welcome to the January 2026 edition of our trading snapshot for New Zealand investors, where we look at the top 20 trades made by New Zealand Sharesight users.

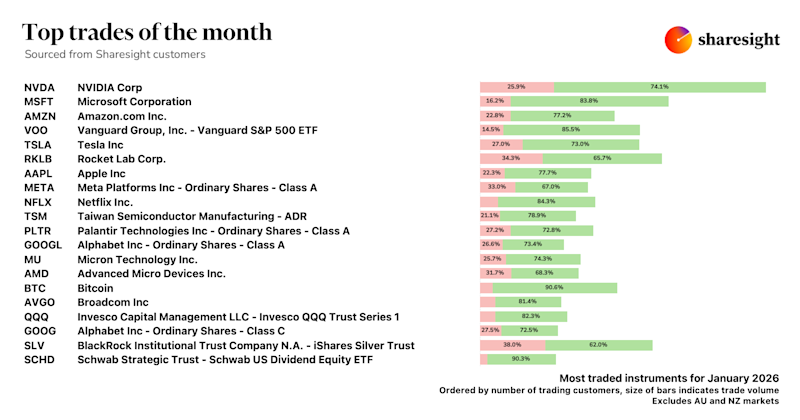
Top trades by global Sharesight users — January 2026
Welcome to the January 2026 edition of Sharesight’s trading snapshot for global investors, where we look at the top 20 trades made by Sharesight users globally.