Track stocks on the London Stock Exchange with Sharesight
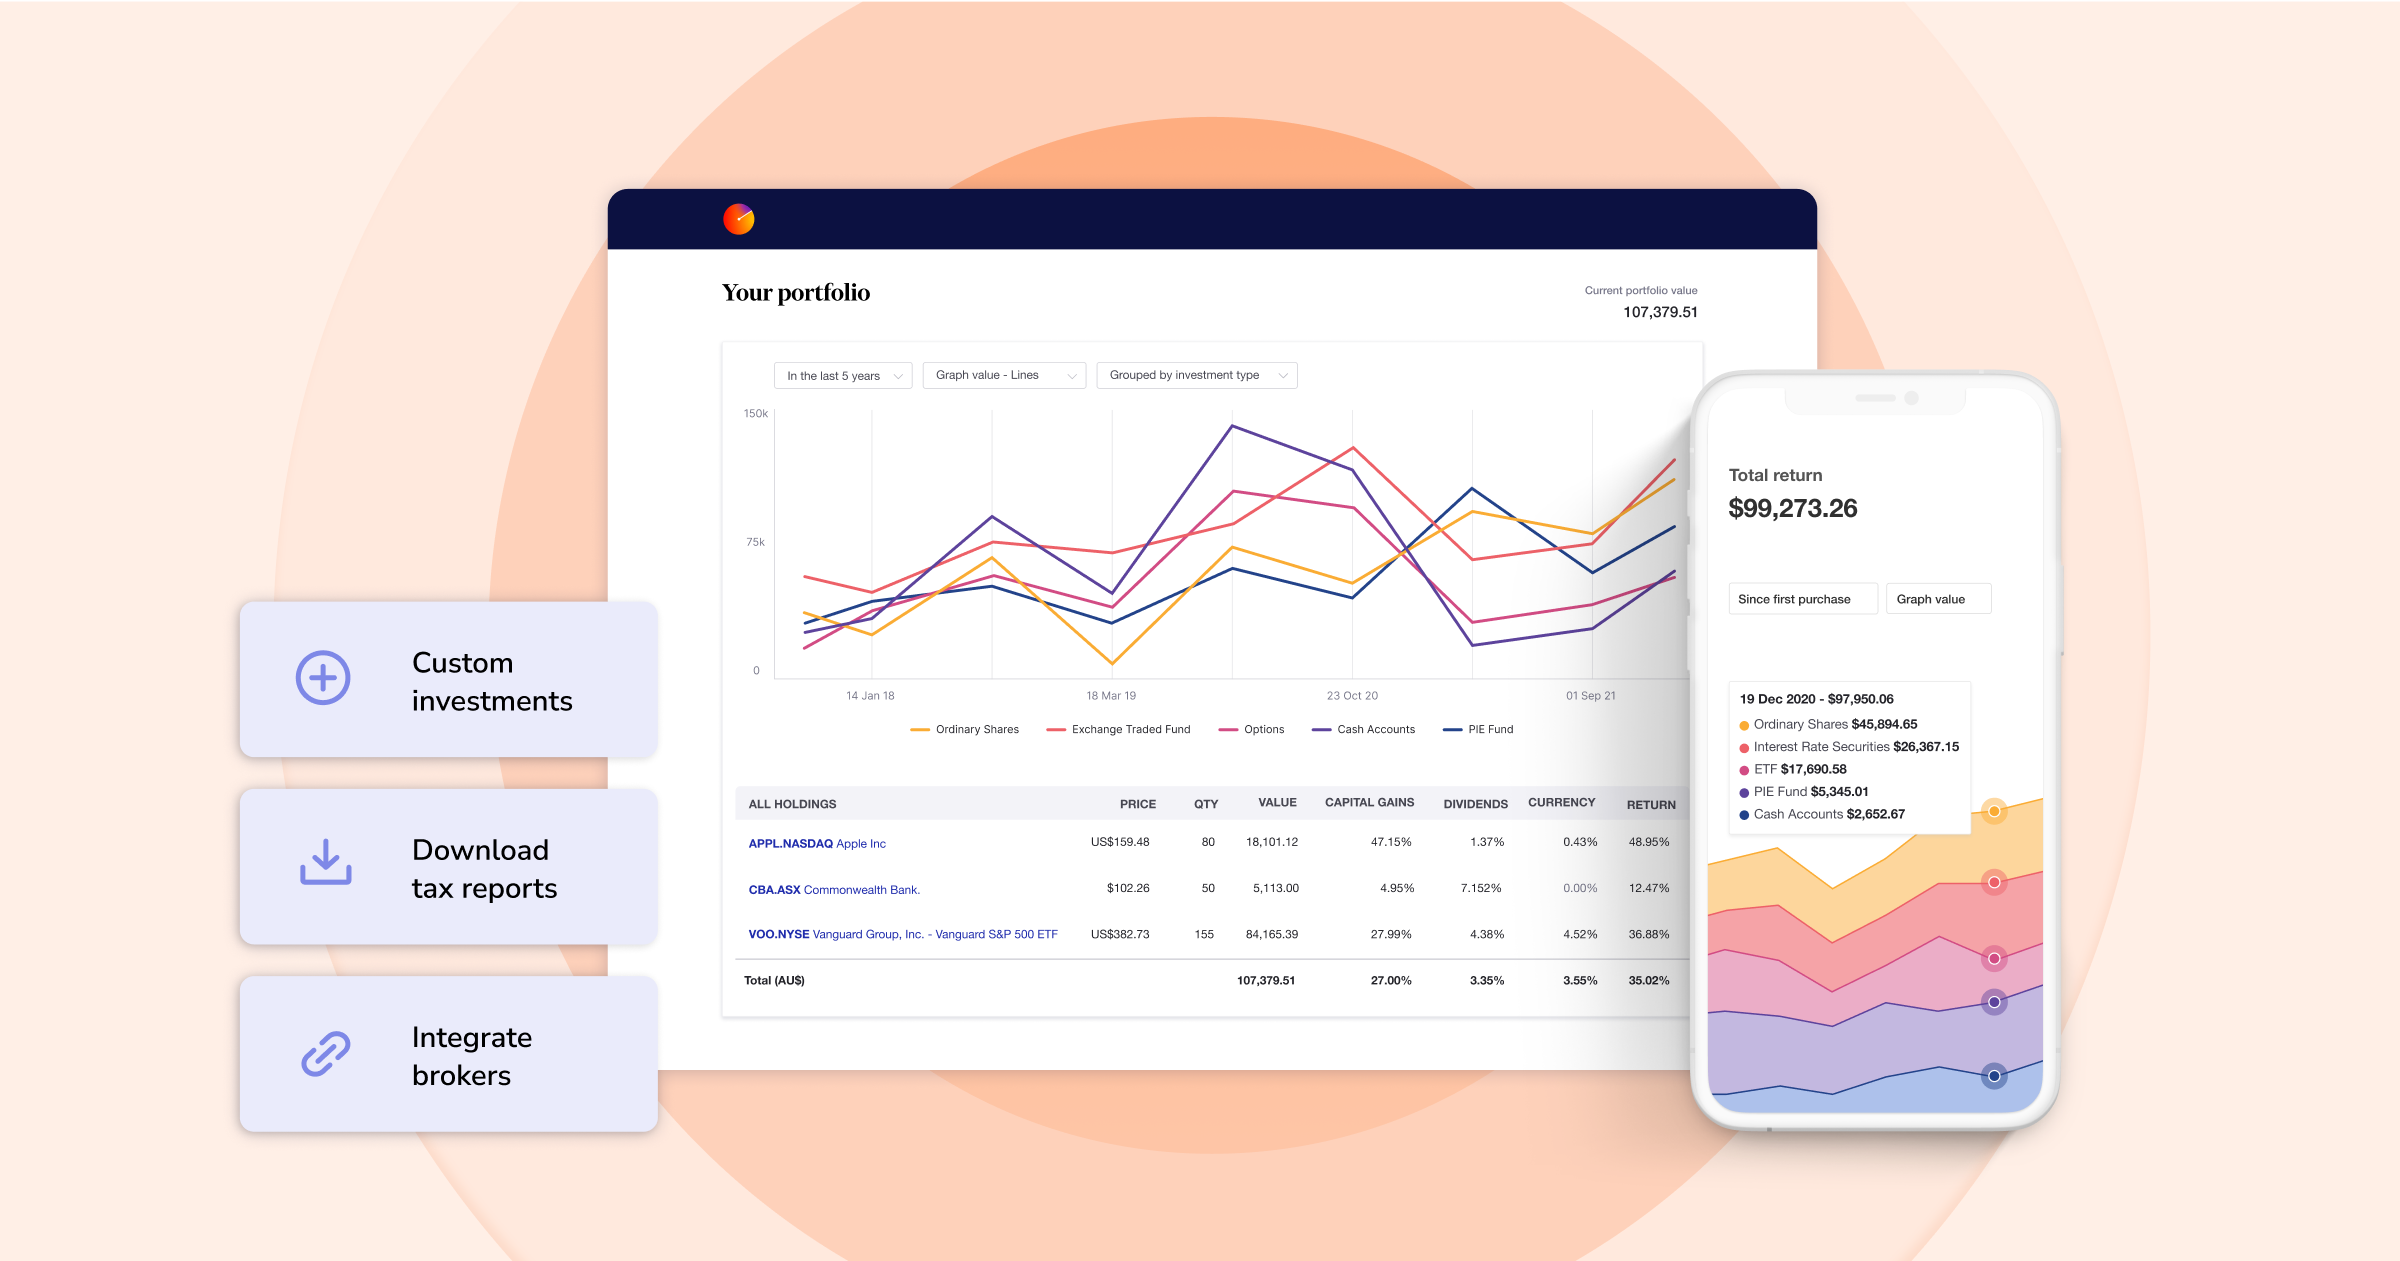
With Sharesight, you can easily track stocks and ETFs on the London Stock Exchange (LSE), with price and performance updates on a 15 minute delayed basis. This is in addition to Sharesight's support for key markets such as the New York Stock Exchange (NYSE), Nasdaq and over 60 other leading global markets. Sharesight’s extensive market support allows you to track all of your global investments in one place, while gaining access to award-winning performance, dividend tracking and tax reporting.
What is the London Stock Exchange?
The London Stock Exchange (LSE) is the primary stock exchange of the United Kingdom, as well as the biggest stock exchange in Europe. Established in 1801, the LSE is also one of the world’s oldest, most diverse and international exchanges. In 2007, the LSE merged with the Milan Stock Exchange, the Borsa Italiana, creating the London Stock Exchange Group.
Why you should track your LSE investments with Sharesight
With Sharesight, you can easily track the price and performance of stocks, ETFs and funds listed on the LSE, alongside investments across multiple global markets, brokers and asset classes. By consolidating all your investments in Sharesight, you gain a portfolio-wide view of your performance, benefitting from intraday pricing for the LSE, plus advanced reporting designed for the needs of self-directed investors. Sharesight’s annualised performance calculation methodology also gives you the complete picture of your portfolio’s returns by calculating the impact of capital gains, brokerage fees, dividends and foreign exchange rates on performance.
Track dividend income from LSE stocks
Unlike other portfolio trackers, Sharesight automatically tracks dividend and distribution income and includes this information when calculating your investment return. In the screenshot below for example, dividends make an important contribution to this stock’s returns, highlighting the value of a portfolio tracking solution that includes more than just capital gains in its performance calculations.
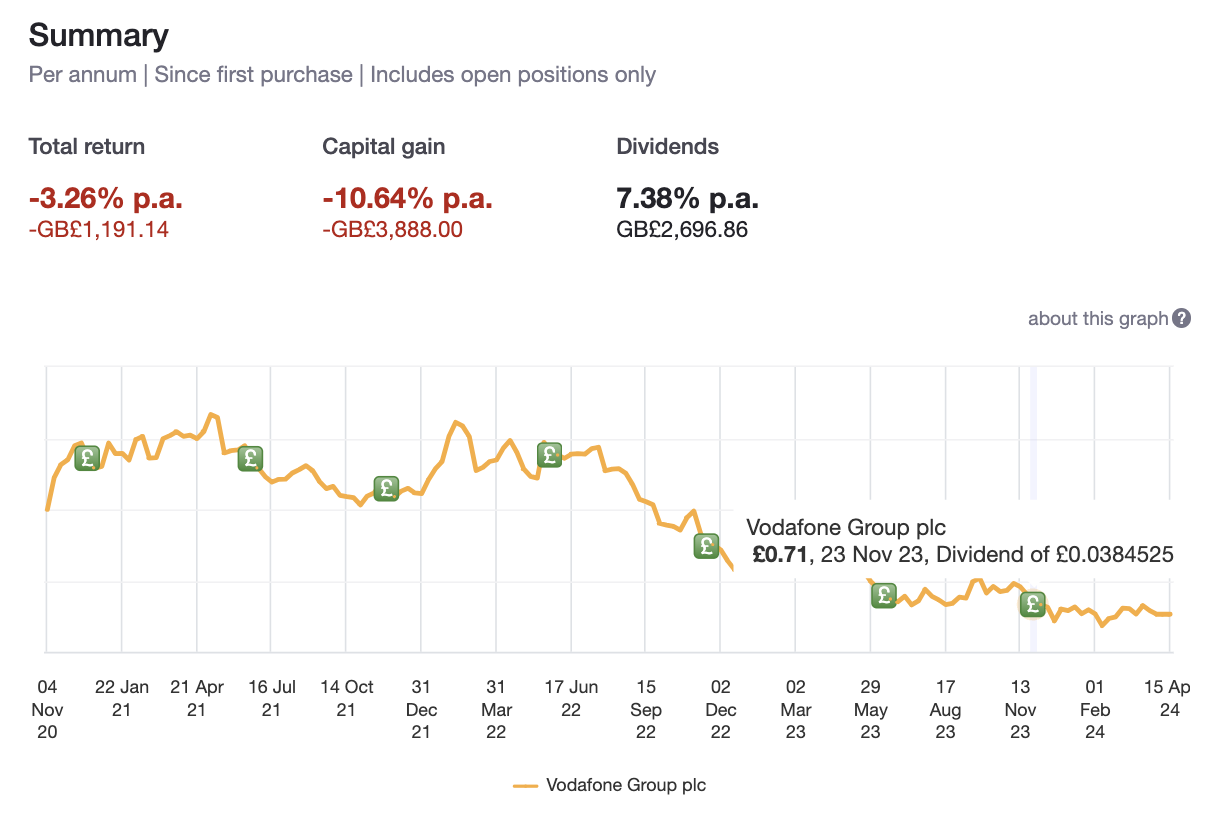 An example of an LSE stock holding with dividends contributing to 7.38% of returns.
Run powerful reports built for investors
For investors who want a more detailed breakdown of their portfolio’s performance, Sharesight offers a range of powerful reports including:
- Performance: Allows you to track the performance of your investment portfolio over any date range, which can be useful for evaluating your investment strategy and identifying areas for improvement.
- Diversity: Shows how your portfolio is diversified across various groupings, such as market, currency, sector, industry, investment type, country or a custom grouping of your choice. It can be used to track your portfolio against your investing strategy (or asset allocation target), helping you determine whether a portfolio rebalance is necessary.
- Contribution analysis: Shows how your individual holdings and asset classes are performing relative to each other, giving you a deeper understanding of the factors contributing to your portfolio’s returns.
- Exposure: Displays your portfolio’s exposure to different industries, investment types and sectors by listing your direct stock holdings alongside any stocks held within exchange-traded funds (ETFs). This allows you to clearly see any overlap in your portfolio.
- Sold securities: See a breakdown of realised gains on any investments you have sold, over any chosen period. This can be used to assess your decision to sell out of certain holdings in your portfolio, or to evaluate your long-term investing strategy.
- Future income: View upcoming (announced) dividend and interest payments for investments in your portfolio. This can be a useful way to forecast your cash flow.
Calculate the impact of LSE investments on your portfolio’s returns
In the screenshot below, you can see the contribution analysis report (sorted by market) being used to assess the ‘weight’ of various markets in a UK investor’s portfolio. This would be particularly useful for an investor looking to compare the relative contribution of their LSE investments to the total return on their portfolio, for instance.
In this example, the LSE is the most significant contributor to the portfolio’s value, constituting 82.71% and £51,322.30, while the biggest detractor is the NYSE, which constitutes -4.09% and -£2.536.81. The report also includes a detailed breakdown of each individual holding’s returns, classified by market.
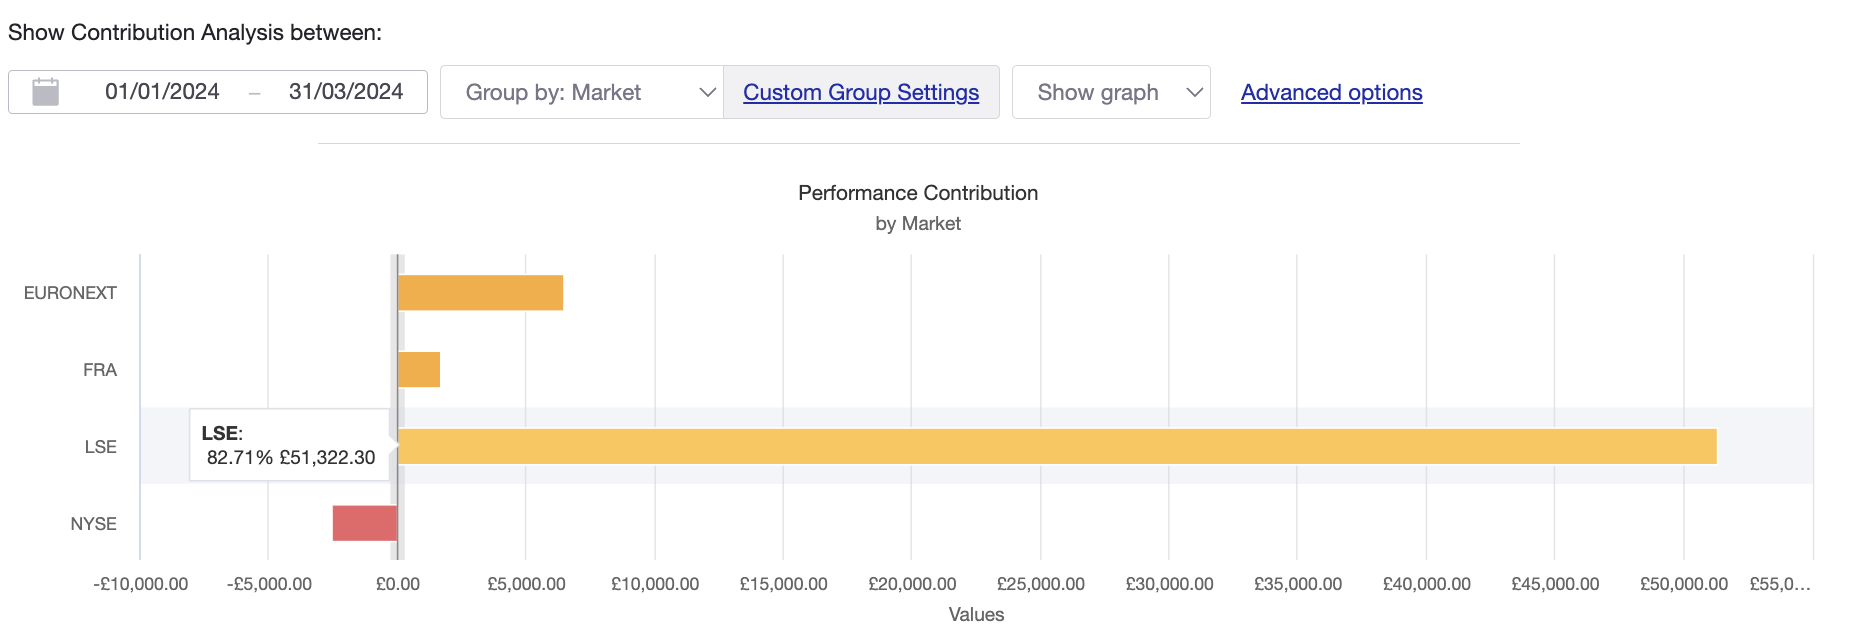 The contribution analysis report being used on a UK portfolio with European and US stocks.
How to track stocks on the LSE with Sharesight
- If you’re not using Sharesight yet, sign up for a FREE account to get started
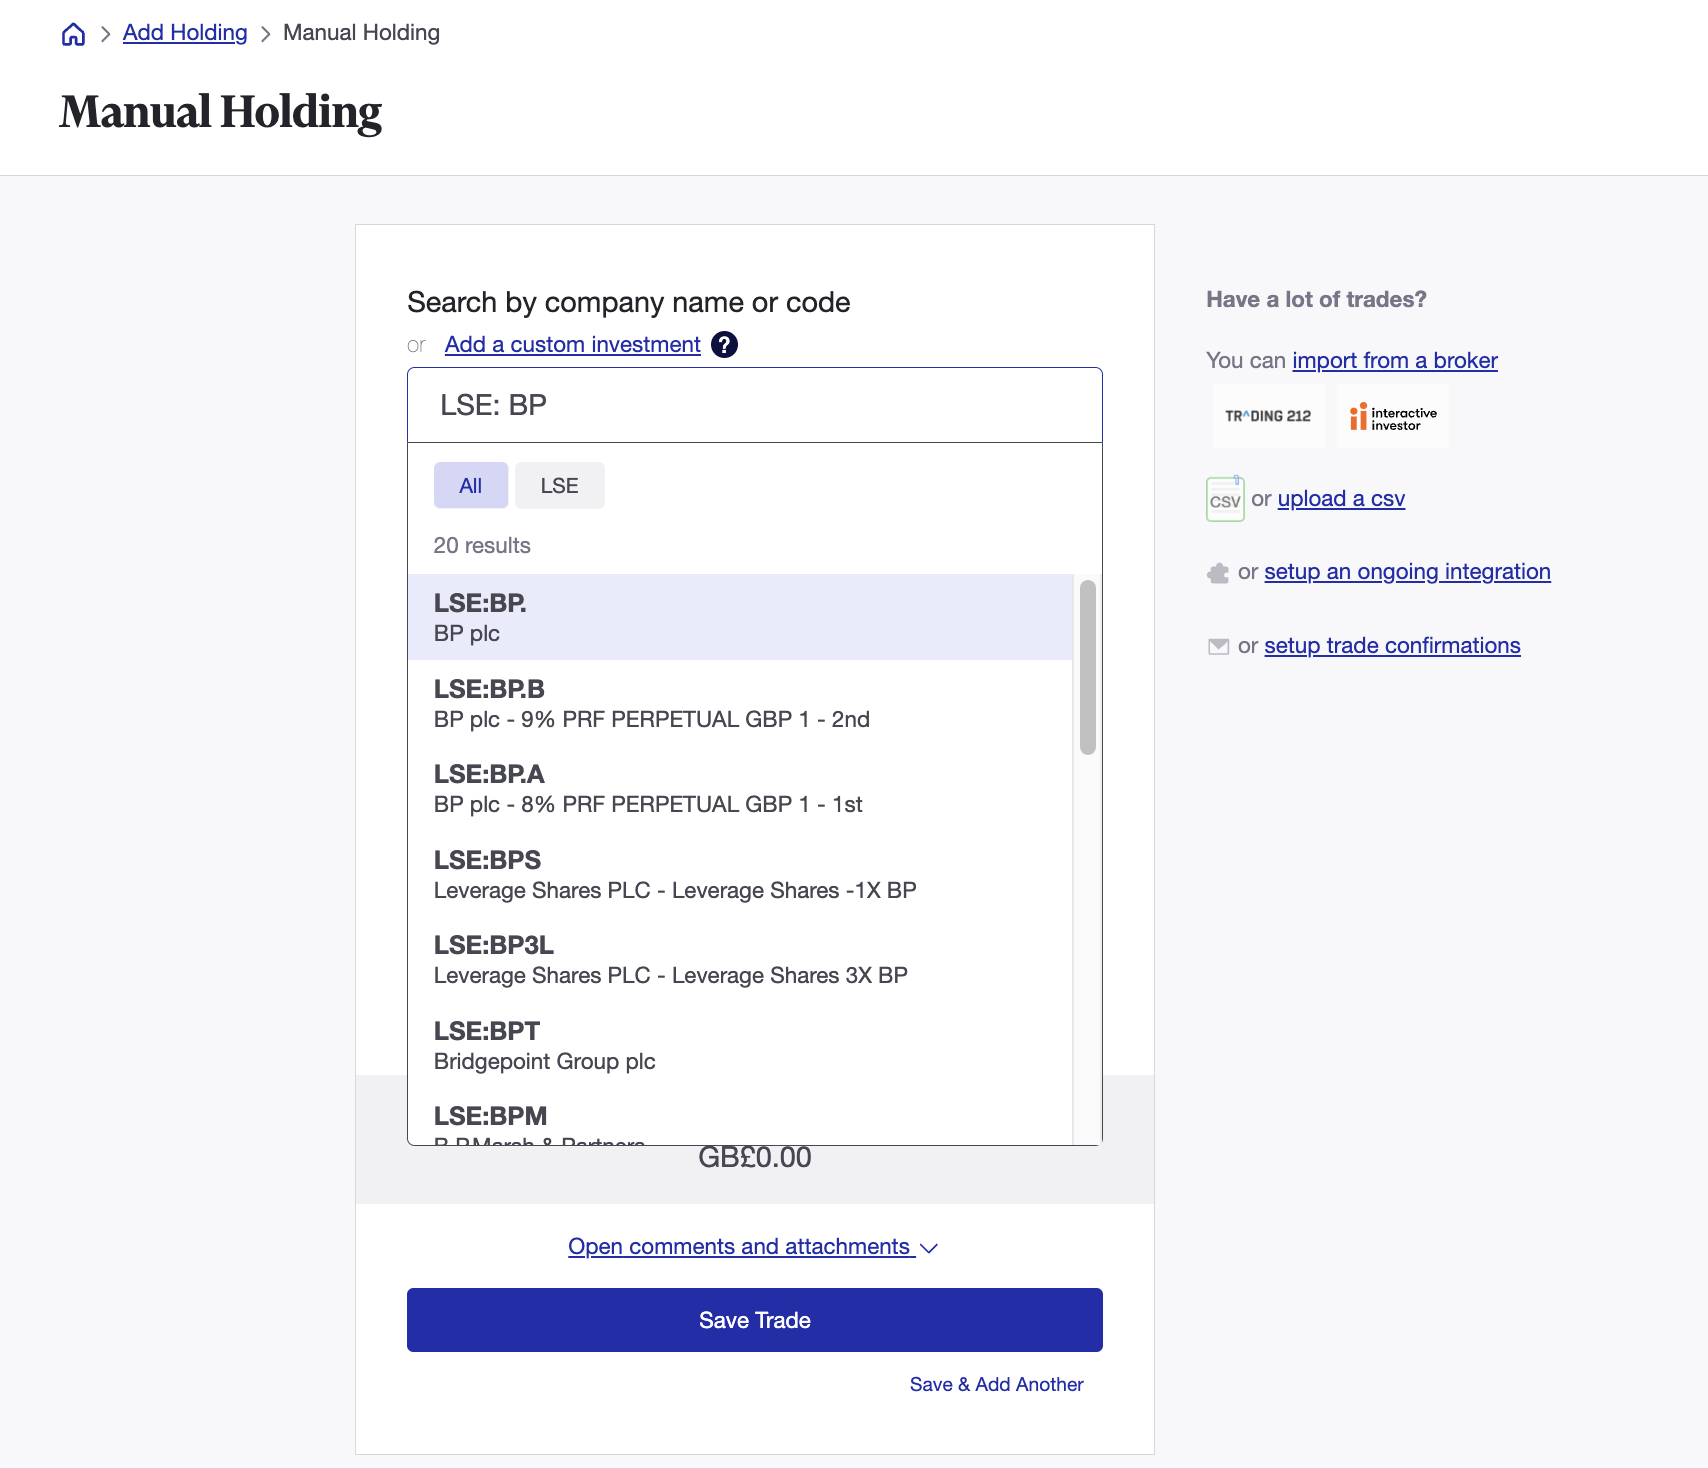
- Add your holdings to your portfolio by searching for the relevant stock code under the market code LSE. Alternatively, you can add holdings by uploading a spreadsheet to Sharesight
- Sharesight will automatically fill in the price history and performance valuation for your holdings throughout the day on a 15 minute delayed basis. It will also backfill past dividends (and continue to add new ones as they are announced) — plus factor in the impact of any currency fluctuations on your performance for international investors.
Track your investment portfolio with Sharesight
Investing in stocks on the LSE and other global markets? You need to track your investment portfolio with Sharesight so you can:
- Track all your investments in one place, including stocks in over 60 major global markets, mutual/managed funds, property, and even cryptocurrency
- Automatically track your dividend and distribution income from stocks, ETFs and mutual/managed funds
- Run powerful reports built for investors, including performance, portfolio diversity, contribution analysis, exposure, multi-period, multi-currency valuation and future income (upcoming dividends)
- Get the true picture of your investment performance, including the impact of brokerage fees, dividends, and capital gains with Sharesight’s annualised performance calculation methodology
Sign up for a FREE Sharesight account and get started tracking your investment performance (and tax) today.
Disclaimer: This article is for informational purposes only and does not constitute a specific product recommendation, or taxation or financial advice and should not be relied upon as such. While we use reasonable endeavours to keep the information up-to-date, we make no representation that any information is accurate or up-to-date. If you choose to make use of the content in this article, you do so at your own risk. To the extent permitted by law, we do not assume any responsibility or liability arising from or connected with your use or reliance on the content on our site. Please check with your adviser or accountant to obtain the correct advice for your situation.
FURTHER READING
8 ways to use Sharesight's custom groups feature
This blog explains our custom groups feature, including strategies that can help you gain deeper portfolio insights and make more informed investing decisions.
You can time the market – and ETFs are the way to do it
Marcus Today founder and director Marcus Padley discusses timing the market, and how investors can do this using exchange-traded funds (ETFs).
Morningstar analyses Australian investors’ top trades: Q1 2025
Morningstar reviews the top 20 trades by Australian Sharesight users in Q1 2025, and reveals where their analysts see potential opportunities.