Track stocks on the NEO Exchange with Sharesight
Sharesight’s portfolio tracker allows investors to track 185 stocks and ETFs on the NEO Exchange, with automatic dividend tracking and daily price and performance updates. This is in addition to Sharesight’s existing support for other key markets such as the Toronto Stock Exchange (TSX), Toronto TSX Ventures Exchange (TSXV), New York Stock Exchange (NYSE), Nasdaq and over 40 other leading global markets. Sharesight’s extensive market and broker support allows investors from around the world to effortlessly track all their investments in one place, while providing them with powerful performance reports, dividend tracking and tax reporting features.

What is the NEO Exchange?
Operating since 2015, the NEO Exchange is a Canadian stock exchange with an online trading platform. The exchange lists over 200 stocks, ETFs and bonds, with an emphasis on senior public companies and investment products. It was established with the aim of discouraging high frequency trading and providing more transparency to investors, as well as the companies listed on the exchange.
Why investors should track their NEO investments with Sharesight
With Sharesight, investors can easily track the price and performance of stocks listed on the NEO Exchange alongside investments across multiple global markets, brokers and asset classes. By consolidating all of their investments in Sharesight, investors gain a portfolio-wide view of their investment performance, benefitting from daily price updates for the NEO Exchange, plus advanced reporting designed for the needs of self-directed investors. In addition, Sharesight’s annualised performance calculation methodology gives investors the complete picture of their portfolio returns by calculating the impact of capital gains, brokerage fees, dividends and foreign exchange rates on performance.
Track dividend income from NEO stocks
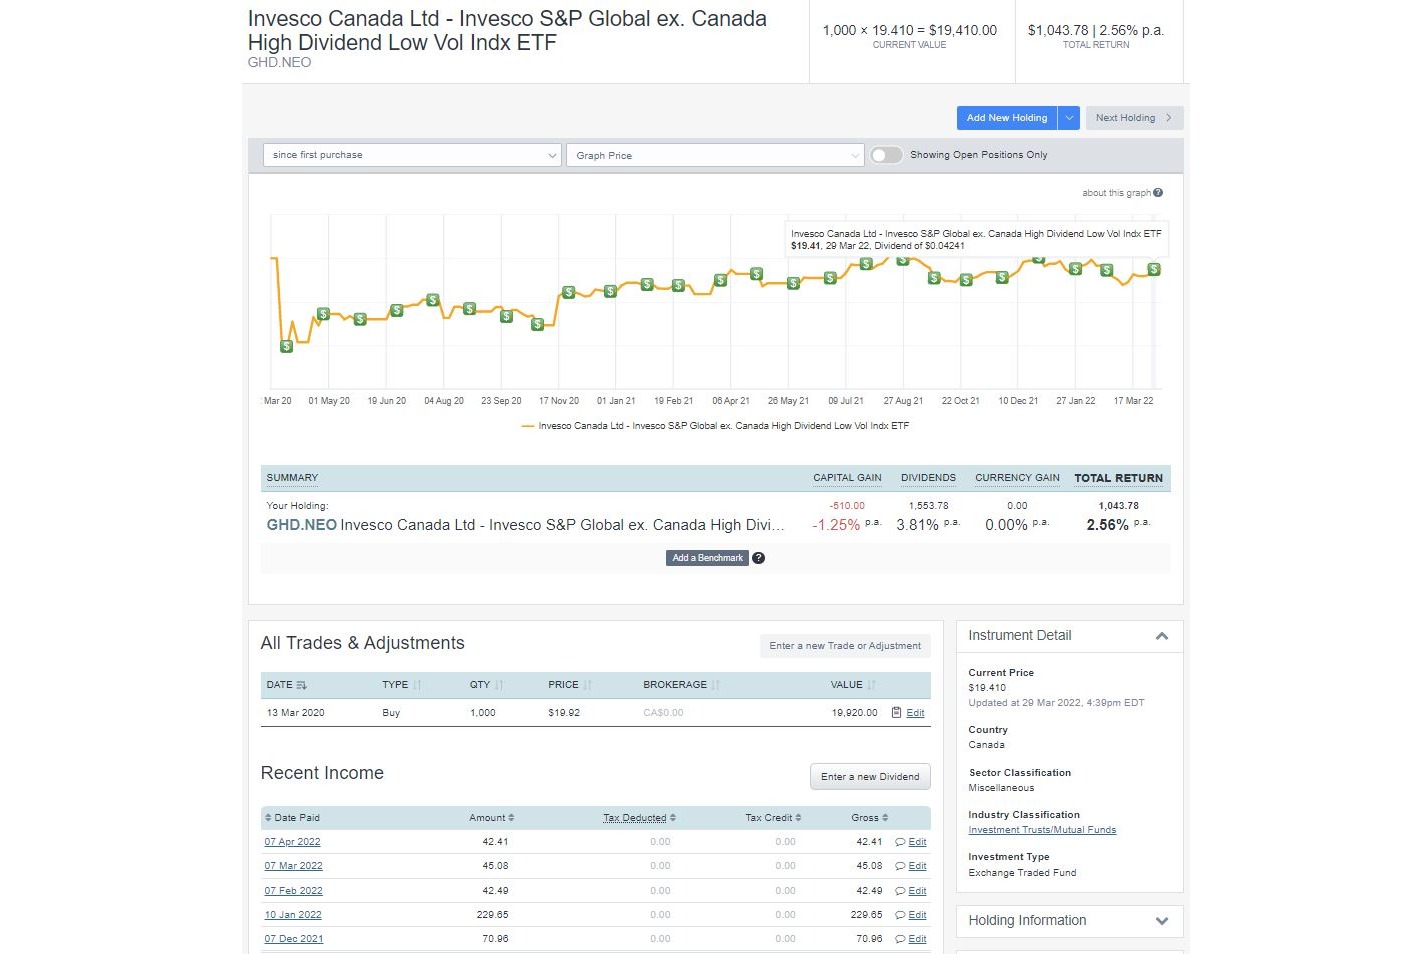
Unlike other portfolio trackers, Sharesight automatically tracks dividend and distribution income and includes this information when calculating your investment return. In the screenshot below for example, dividends make an important contribution to this stock’s returns, highlighting the value of a portfolio tracking solution that includes more than just capital gains in its performance calculations.

An example of a NEO stock holding with dividends contributing 3.81% to the total return, along with capital losses of 1.25%.
Run powerful performance reports built for investors
For investors who want a more detailed breakdown of their portfolio’s performance, Sharesight offers a range of powerful reports including:
-
Performance: Calculate your total portfolio returns over any selected period.
-
Diversity: Discover how the assets in your portfolio are diversified across different investment sectors, investment types, countries and markets.
-
Contribution Analysis: Measure the impact of your holdings and asset allocations on your overall portfolio performance.
-
Future Income: View announced dividends and interest payments expected for investments in your portfolio.
-
Multi-Currency Valuation: See the value of your holdings denominated in the currency of your choice.
-
Multi-Period: Compare your portfolio returns over different time frames to see the impact of time on your performance.
Calculate the impact of NEO investments on your portfolio’s returns
In the screenshot below, you can see the Contribution Analysis Report (sorted by market) being used to assess the ‘weight’ of various markets in a Canadian investor’s portfolio. This would be particularly useful for an investor looking to compare the relative contribution of their NEO investments to the total return on their portfolio, for instance.
In this example, the NEO Exchange is the most significant contributor to the portfolio’s value, constituting 42.53% and $42,976, followed by FundCA (Canadian mutual funds) at 32.39% and $32,727. The report also includes a detailed breakdown of each individual holding’s returns, classified by market.
The Contribution Analysis Report being used on a Canadian investor’s TFSA portfolio with investments in Canadian mutual funds, plus stocks on the NEO and Toronto stock exchanges.
How to track stocks on the NEO Exchange with Sharesight
-
If you’re not using Sharesight yet, sign up for a FREE account to get started.
-
Add your holdings to your portfolio by searching for the relevant stock code under the market code NEO. Alternatively, you can add holdings through Sharesight’s File Importer feature.
-
Sharesight will automatically fill in the price history and performance valuation for your holdings by end-of-day on a daily basis. It will also backfill past dividends (and continue to add new ones as they are announced) – plus factor in the impact of any currency fluctuations on your performance for international investors.
Track your investment portfolio with Sharesight
Investing in stocks on the NEO Exchange and other global markets? You need to track your investment portfolio with Sharesight so you can:
-
Track all your investments in one place, including stocks in over 40 major global markets, mutual/managed funds, property, and even cryptocurrency
-
Automatically track your dividend and distribution income from stocks, ETFs and mutual/managed funds
-
Run powerful reports built for investors, including Performance, Portfolio Diversity, Contribution Analysis, Multi-Period, Multi-Currency Valuation and Future Income (upcoming dividends)
-
Get the true picture of your investment performance, including the impact of brokerage fees, dividends, and capital gains with Sharesight’s annualised performance calculation methodology
Sign up for a FREE Sharesight account and get started tracking your investment performance (and tax) today.

FURTHER READING

Sharesight product updates – February 2026
This month's key focus was on the rollout of the new Investments tab to all users, along with various enhancements across web and mobile.

Top trades by New Zealand Sharesight users — January 2026
Welcome to the January 2026 edition of our trading snapshot for New Zealand investors, where we look at the top 20 trades made by New Zealand Sharesight users.

Top trades by global Sharesight users — January 2026
Welcome to the January 2026 edition of Sharesight’s trading snapshot for global investors, where we look at the top 20 trades made by Sharesight users globally.