Sharesight performance improvements Q&A
When you’re looking at your investment portfolio in Sharesight, you may not be aware that we calculate performance using the latest available data to give you the most accurate picture of your portfolio. This often means running computationally expensive calculations “on the fly”, particularly when calculating your portfolio performance over large timeframes or on a portfolio containing a large number of transactions. Improving the performance of the Sharesight website is a key focus here at the moment, and we’ve been making some important ‘behind the scenes’ improvements lately, so I sat down with the Sharesight developers to find out more:
Firstly, tell us a bit about the development team at Sharesight
From the servers Sharesight runs on, to the market price data feeds we load from our partners, to our performance calculations, technology is at the core of everything Sharesight does. The responsibility for ensuring the technology that underpins Sharesight is well maintained and continues to run smoothly rests with our development team.
The Sharesight team is from very diverse backgrounds and countries, though the majority of the development team is based in Wellington New Zealand. We work hard to prevent “silos” of information amongst the team, and make sure that we’re all capable of dealing with any part of Sharesight.
The team develops, implements and maintains all the features in Sharesight, plus we’re responsible for monitoring server infrastructure and keeping Sharesight updated with the latest market prices and exchange rates from data partners. As we’re based around the world and across multiple time zones, there’s always someone ready to jump into any technical problem that may arise.
What tools do you use to monitor Sharesight’s technical performance?
We use Datadog as our main instrumentation tool. Datadog is a window to our infrastructure, as it allows us to see how our servers are performing and how the changes we make impact our performance. Using Datadog APM (application performance manager), we can zoom in to see how each component of the application is running on our servers.
We can also locate the parts of Sharesight (endpoints) that perform the slowest but are used most frequently. Armed with this knowledge, we can concentrate our development efforts on improving the parts of Sharesight where there is the most user impact
Measuring performance is not enough though. We also need to make sure these metrics are visible so we have a live dashboard in our office that displays the most important metrics across Sharesight’s infrastructure. By having this data visible to the whole team, it gives us an intuitive feel for the metrics, drastically reducing the time it takes to respond to an issue.
Sharesight switched to the Amazon Aurora database recently -- speeding up some calculations by as much as 5x. What else have you been working on to improve performance?
We’re currently working hard in modernising Sharesight’s interface, implementing React (a javascript library for building user interfaces), and bringing best practices from the fast-changing front-end development industry.
This modernisation started quite a while ago, by making Sharesight responsive across various platforms (making sure it will work well on the tablet, phone, desktop, etc). Apart from improving mobile usability, this change improved the time to “first meaningful paint” (page load) by over 60% when opening trade and payout forms!
Can you give an example where Sharesight now performs measurably faster?
One example is the improvements we’ve made to the Sharesight trade and payout forms when moving to a responsive design. In our testing, we’ve recorded that Sharesight now saves roughly 2.5 seconds on the time to load these pages. That may not seem like a lot, but it’s actually a huge improvement and not an easy feat, especially considering how much data-loading and real-time calculations are taking place.

What other impacts will users see as a result of these improvements going forward?
This is a continuous process. Technology changes really fast, and new, better and faster hardware will quickly outpace current performance benchmarks. Also, the best practices in software development that we use today will evolve over time. But by using tools like Datadog to monitor Sharesight’s performance, we will always find ways to continually improve it.
Here are the next big performance tasks in the pipeline:
Improved calculation caching: Sharesight calculates portfolio performance figures on the fly when loading a page. These calculations can be computationally heavy on larger portfolios or those with significant trading history. Once we have enough React components in the front-end of the site, we’ll be able to cache and reuse a lot of the results from these calculations to speed up page load times if viewing the same page multiple times. This will make navigating around Sharesight a lot faster.
Improving compute load distribution: We’re changing some of our server components to make better use of Sharesight’s existing servers and evenly distribute the workload. This will improve how Sharesight performs during the day, particularly during peak usage periods.
FURTHER READING

Why Strawman’s founder uses Sharesight to track performance and tax
We spoke with Andrew Page, founder of Strawman.com, about how he uses Sharesight to track his portfolio and how it benefits investors.

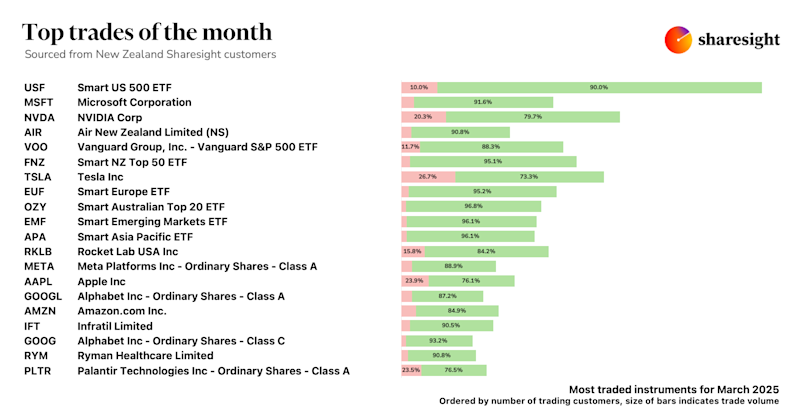
Top trades by New Zealand Sharesight users — March 2025
Welcome to Sharesight’s March 2025 trading snapshot for New Zealand, highlighting the top trades made by New Zealand Sharesight users.

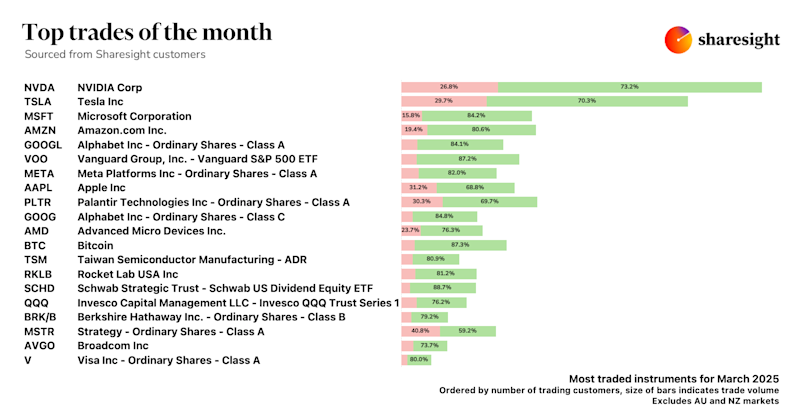
Top trades by global Sharesight users — March 2025
Welcome to the March 2025 edition of Sharesight’s trading snapshot, where we review the top trades made by Sharesight users worldwide.