Questions to ask before investing in Spaceship
Spaceship, a new super fund aimed at young investors and those seeking technology exposure is set to launch. I must fit their target demographic -- not a day goes by that I don’t see their ads on Facebook.
They’re attracting headlines -- positive and negative -- in the financial press.
I support efforts to get younger people interested in investing. I’m also preferential to technology stocks. Combine that with Australia’s compulsory superannuation system and you’ve got the potential for something impactful (a close parallel to roboadvice). Motivated by a recent headline accusing Spaceship of high risk and not high enough returns I wanted to see if I could rebuild it using Sharesight.
In addition to revealing Spaceship’s performance, I want to know:
- What’s in it?
- How much does it cost?
- What does this mean for their target audience?
According to their website, Spaceship will “invest in the future” via a “diversified portfolio with technology at its core.” They reveal a sample $100k portfolio, down to the value they allocate each stock.

Before I go further, Spaceship should be commended for revealing what’s actually in their portfolio -- most super funds don’t, which leaves investors in the dark.
Importantly their site says the portfolio is a representation of the fund’s largest holdings as at 4 January 2017. I’m backdating the portfolio by one year (to 1 March 2016) and using only the information they disclose.
Their site shows 72 holdings in both “Tech” and “The Rest.” Tech receives $34,170 and The Rest $65,830, including $7k in cash and fixed interest. That’s roughly 34% tech, 66% non tech.
The 72 investments they list only add up to $55,000. Does that mean $45k is invested somewhere else? I’m not sure, but let’s go with the information we do have.
To recreate in Sharesight, I bought each company on 1 March 2016 for the dollar amount they’ve stated. I work backwards from the closing price on that day, while factoring in the currency conversion. For ASX holdings, I round up or down to the nearest whole unit (US markets allow fractional holdings). I’ve chosen not to reinvest the dividends because their prospectus doesn’t specify.
I didn’t add brokerage fees, but I will factor in their annual fee (ICR), which I assume includes brokerage and other costs.
All holdings are faithful to the securities they’ve listed. In the case of Tencent, however, I used the Hong Kong listed version as we don’t have data for the vehicle they use. The relative performance should be the same, but this introduced a small $28 loss on the foreign exchange.
For cash and fixed interest, I created two custom investments with appropriate interest payments.
How has Spaceship performed?
Including their 1.6% p.a. fee, from 1 March 2016 to 14 March 2017, Spaceship delivered an 18% annualised return, or $10,563 on our initial investment of $55,000.
Fees are hard to grasp. Here’s an easy way to think about it: Spaceship kept about 10% of the money they made me.
What they lost to currency headwinds they made up for in dividend income. However, they fell short of an ETF that tracks the ASX 200 (STW):
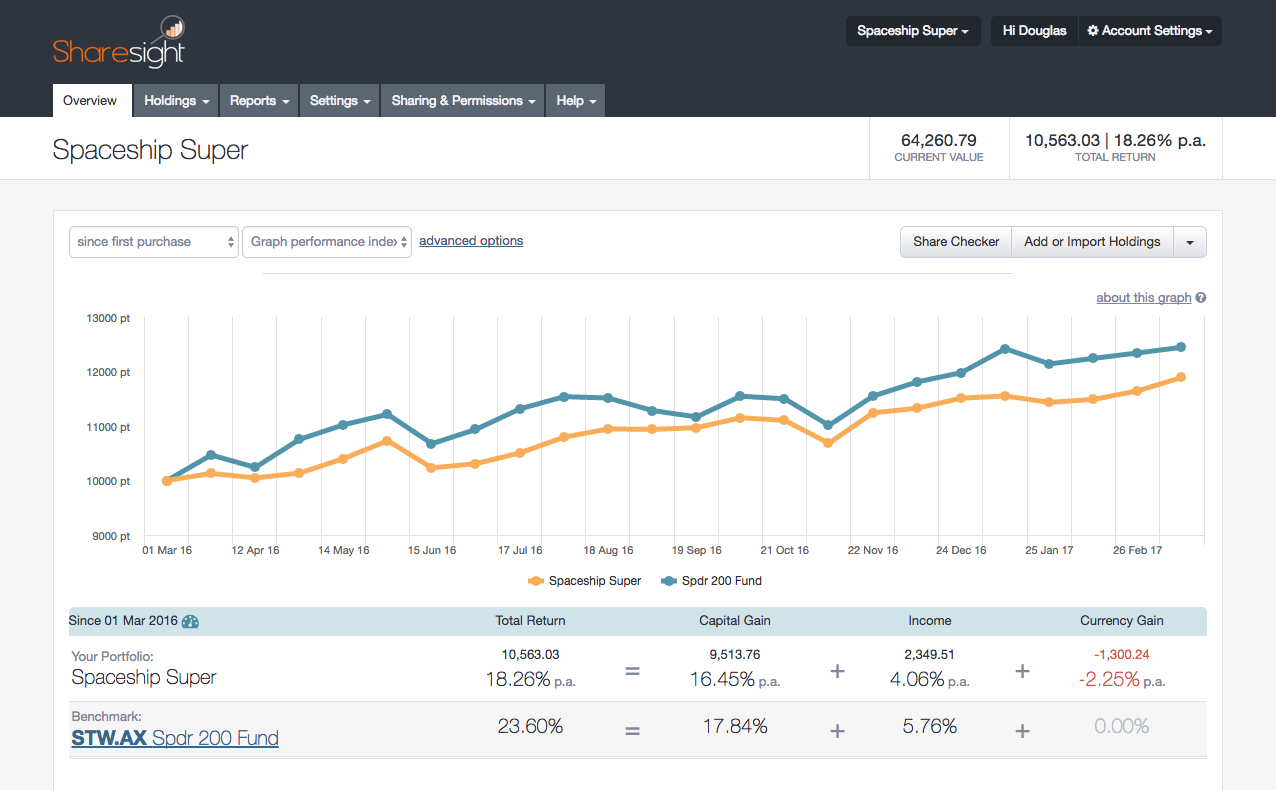
The ASX 200 isn’t the best benchmark given so much of the portfolio is invested in overseas tech. Here’s how Spaceship stacks-up against some alternatives:
| Investment | Return %1 |
|---|---|
| Global Tech ETF (IXN) | 28% |
| S&P 500 ETF (SPY) | 18% |
| Spaceship | 18% |
| Aussie Property ETF (VAP) | 7% |
| Snapchat (SNAP) | -13% |
1ETF performance is net of fees, from 1 March 2016 through 14 March 2017. Snapchat performance since IPO.
How techy is Spaceship?
A traditional sector breakdown shows tech exposure of 32% if you add up the relevant categories - in line with what Spaceship says (Sharesight also uses the GICS industry classification method that Spaceship mentions on their site):
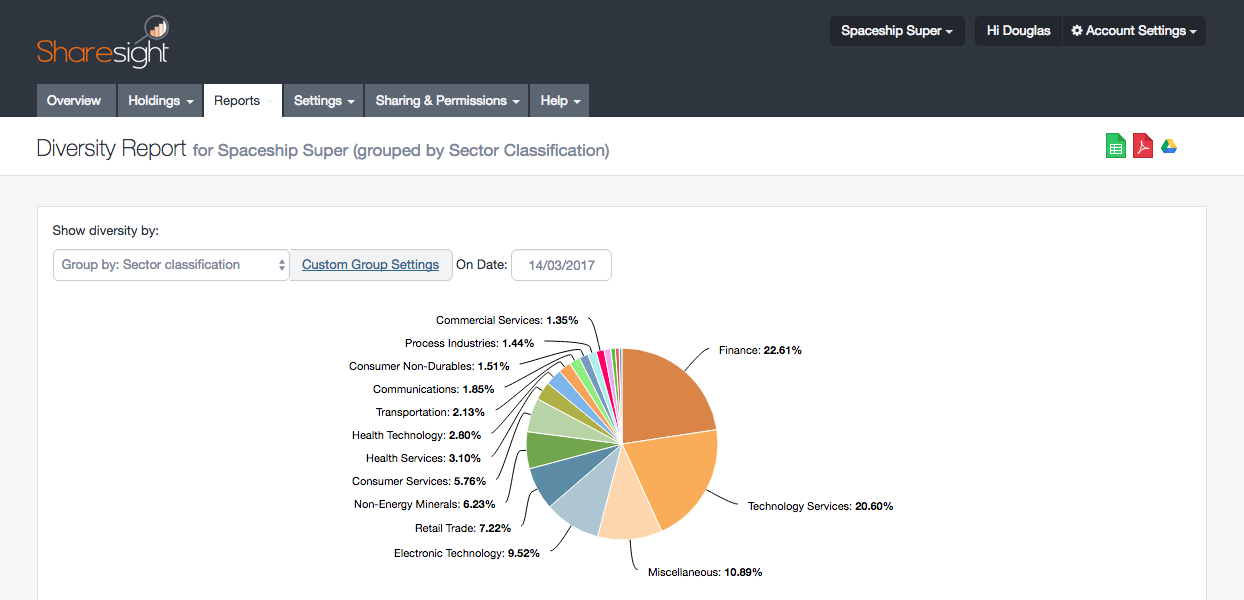
But what makes a tech stock a tech stock? What risk premium do we attach to tech in 2017? Sector and industry classifications fall short of explaining how tech companies earn revenue.
Google and Facebook aren’t risky alternatives to TV and radio. They represent the world’s advertising platform. Visa, Mastercard, and Equinix are not Finance companies. They’re tech companies sitting on mountains of data. Alibaba doesn’t belong in the same category as Woolworth’s (Retail Trade), nor does Accenture belong with Facebook (Technology Services).
So I’ve reclassified things using custom groups in Sharesight:
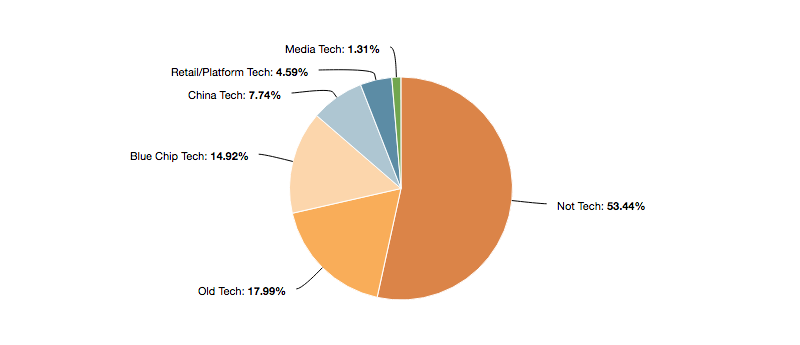
This gives us a more practical look at Spaceship’s exposure and shows us their tech weighting is actually 46%.
How does this affect Spaceship’s return?
We know Spaceship delivered a return of 18%, but where did those gains come from?
Not tech. At least not yet.
Using the same customised worldview as above, a performance attribution report reveals 49% of Spaceship’s $10,563 return came from the Not Tech category. Old Tech was the second biggest return driver, comprising 15%. Media Tech was the closest category to a loss, delivering only 1%.
This is also a useful way to visualise how fees impact your portfolio. Fees took away more money from Spaceship’s return than Carsales, Salesforce, Priceline, Netflix, Expedia, and eBay delivered combined.
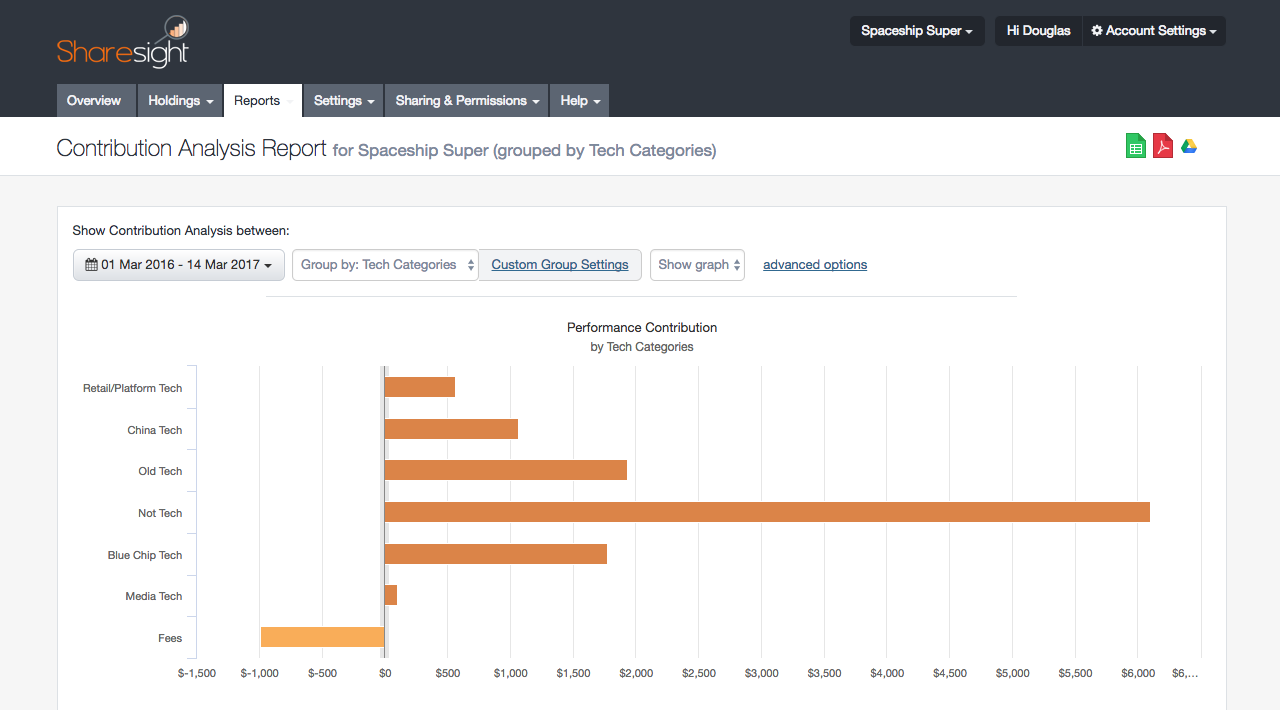
The single best performing industry inside the portfolio was banking. The Big Australian 4 plus Wells Fargo delivered 18% of Spaceship’s total return. Perhaps disheartening to some, but reassuring to others.
So where is Spaceship heading?
One year’s performance is not enough time to judge a long-term investment. This portfolio was built based on information provided on a marketing website -- those are two important facts. Also, professional fund managers are paid to manage portfolios so this portfolio will change.
Research demonstrates Australians’ portfolios are underweight tech so Spaceship’s 46% exposure is a welcome entrant onto the scene. But the same findings show Australians’ portfolios suffer from home country bias, so what to make of 60% of the fund staying onshore? Is Spaceship not tech-focussed enough? Or is it too exposed to an Australian housing implosion? I could go on, but only the bottom line (or Sharesight) will be able to judge.
Interesting to see what a technology portfolio looks like through the eyes of an Australian fund manager. Depending on classification, there are maybe five Australian tech companies in this portfolio of 72 stocks. On a valuation basis, this means less than 5% of the entire portfolio is devoted to local tech. To their credit they state plans to add private companies to their portfolio in 2017.
Here’s hoping we see new Australian tech companies appear on Spaceship’s radar.
Questions young investors should ask
24% of Sharesight users are under 34. They often ask for investing tips. In the case of Spaceship, I would encourage them to consider:
- How risky is tech? What will the companies in this portfolio be doing in 10 years?
- Are you willing to hand back about 10% of your total return to a fund manager?
- Do you have other investments, and what are they exposed to?
- Where do you think the Australian economy is headed?
- Are you capable of building a similar portfolio yourself through shares and ETFs?
There are more factors to consider, but those five questions are a good way to get the conversation going.
So far Spaceship has delivered returns in line with the global market. It will be interesting to see if tech carries the portfolio when interest rates rise and if we have a broad market selloff.
Track the Spaceship portfolio
We've made it easy for anyone to track the Spaceship portfolio. Here are 2 ways to do it:
- Anyone may view and track it via the Spaceship Public Portfolio:
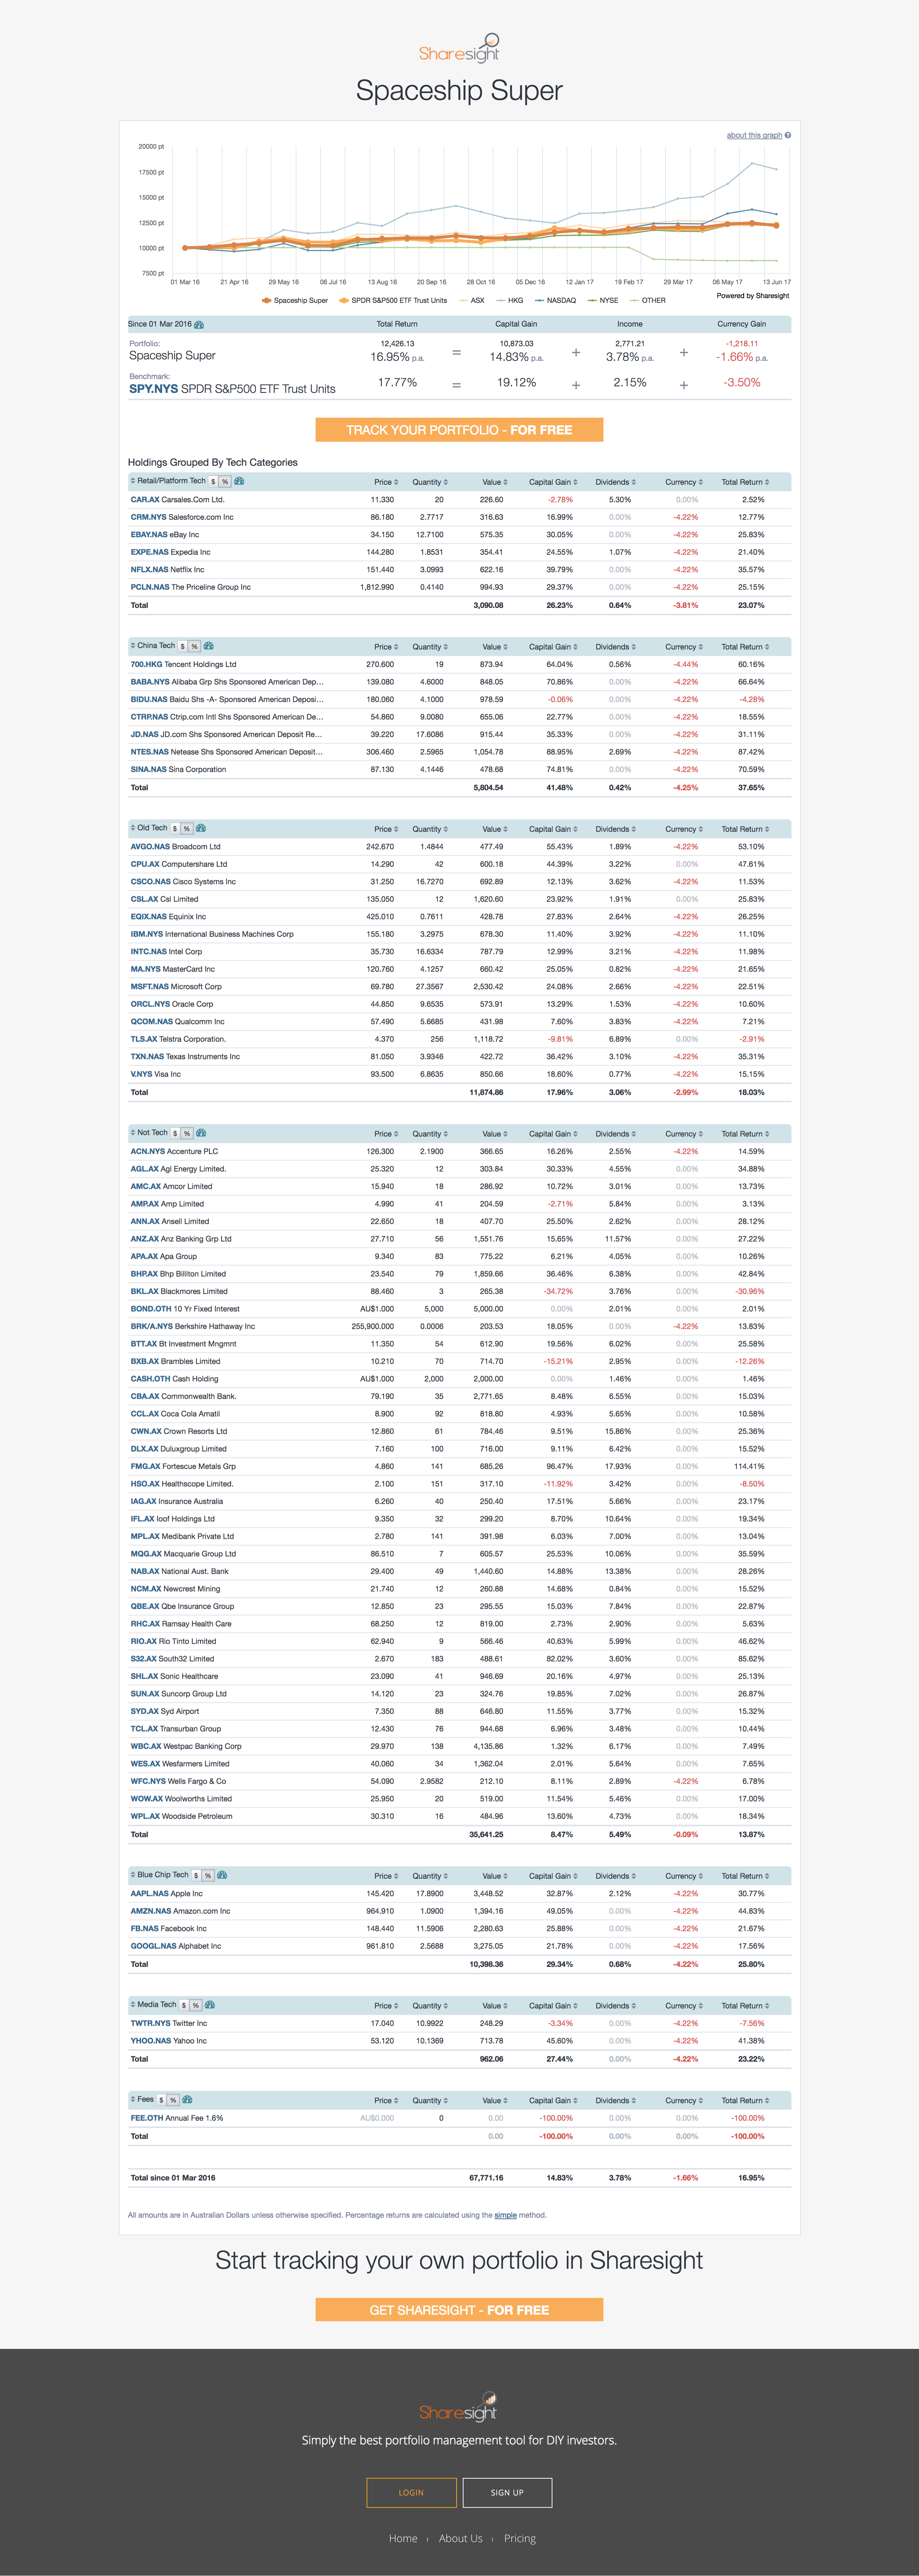 2. If you wish to track the Spaceship portfolio (including all reports mentioned) alongside your own investment portfolio, simply sign up for a FREE Sharesight account and request to have the portfolio shared with you by emailing us at sales(at)sharesight.com.
(I am not a registered financial advisor, nor do I manage money professionally. All opinions expressed are personal.)
FURTHER READING

Sharesight users' top trades – December 2025
Welcome to the December 2025 edition of Sharesight’s monthly trading snapshot, where we look at the top buy and sell trades by Sharesight users over the month.
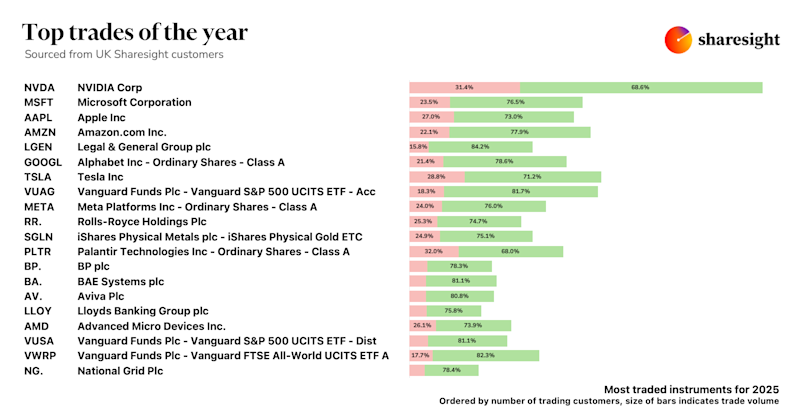
Top trades by UK Sharesight users in 2025
Welcome to the 2025 edition of our UK trading snapshot, where dive into this year’s top trades by the Sharesight userbase.
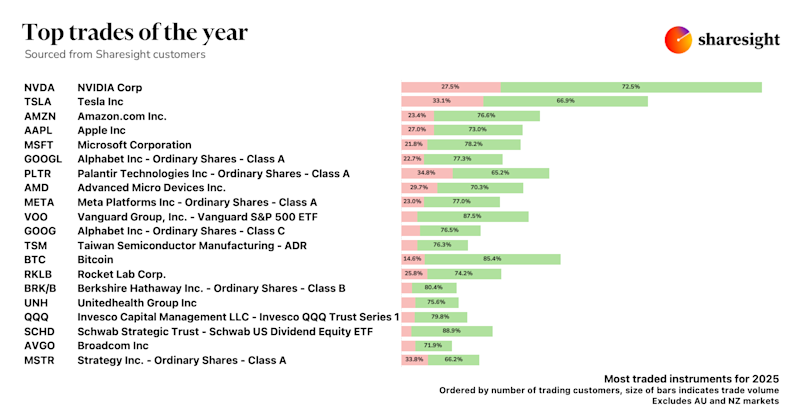
Top trades by global Sharesight users in 2025
Welcome to the 2025 edition of our global trading snapshot, where we dive into this year’s top trades by Sharesight users around the world.