Prepare your annual accounts with our historical cost report
Sharesight’s historical cost report allows you to easily compare the market value and historical cost of investments in your portfolio over any selected period. This report is a powerful tool for investors who need to prepare annual accounts, such as SMSF trustees or those with shares under a company or family trust, who may need to use mark-to-market accounting for their financial statements. To learn more about how to make the most out of the historical cost report, keep reading.

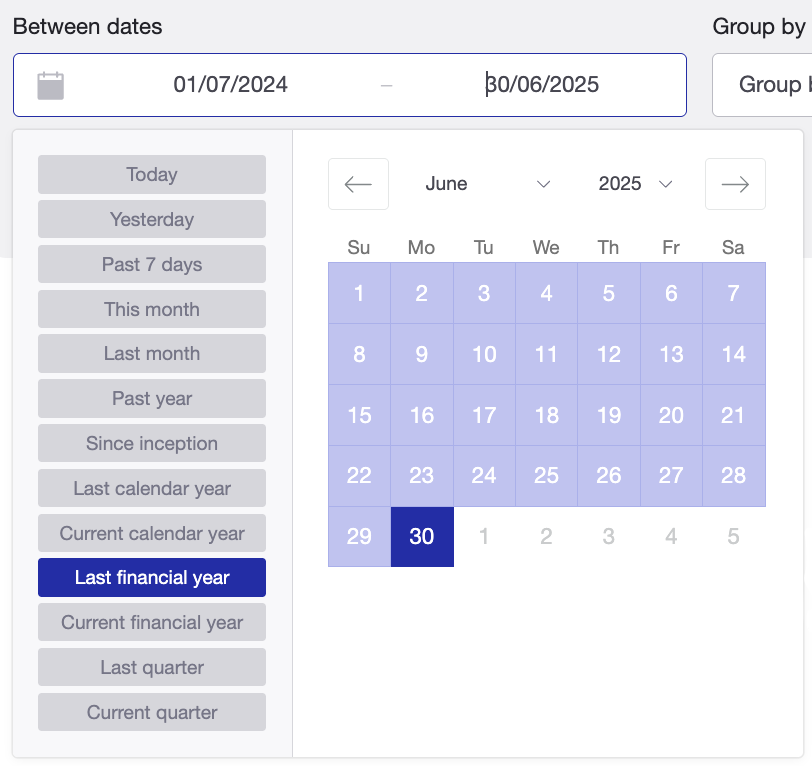
1. Run the report over any date range
The historical cost report allows investors to view the value of their holdings over the time period of their choice. For example, investors may choose to view the value of their holdings over the previous financial year for tax reporting or preparing SMSF annual accounts, or over custom quarterly and annual periods for balance sheet preparation.
2. Break down and analyse costs by their respective components
In the report, costs are split into a range of key components, the values of which can be arranged in ascending or descending order. For example, for holdings with buy or sell trades made during the selected period, you can view the value of purchases and sales, and compare these values with the opening and closing balance to see how the value of your holdings at cost price has increased or decreased over the period.
Most importantly, you can easily compare the difference between the holding’s closing balance and its closing market value. This will determine any unrealised capital gains or losses on the holding, should you need to provide this information in your SMSF annual accounts, taxes or other financial statements.
 With the historical cost report, you can easily compare asset values such as the opening and closing balance, purchases, sales and closing market value.
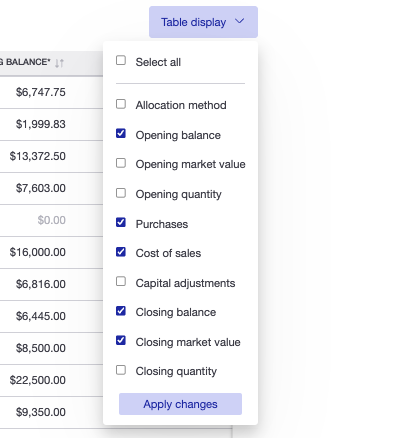
The full report includes the following values:
- Sale allocation method
- Opening balance
- Opening market value
- Opening quantity
- Purchases
- Cost of sales
- Capital adjustments
- Closing balance
- Closing market value
- Closing quantity.
If you wish to see fewer values on the report, simply select the 'Table display' dropdown menu on the upper right and untick any values that you do not wish to see.
Note: If you are looking for an easy way to calculate unrealised capital gains or losses on your investments (but don’t require it for financial accounts), Sharesight also has an unrealised CGT report for Australian tax residency portfolios. For realised capital gains, there is also a capital gains tax report for Australian and Canadian tax residency portfolios.
3. Take advantage of a range of advanced reporting options
Include brokerage
You can choose whether or not to include brokerage fees in your report, which affects the opening balance of their holdings. This allows brokerage to be treated as an expense if it is not included, or to be included in the cost base of the holdings, depending on your entity’s tax treatment.
Change grouping classifications
You can organise the holdings in your report by default groupings including market, sector, industry, investment type, country or no grouping at all.
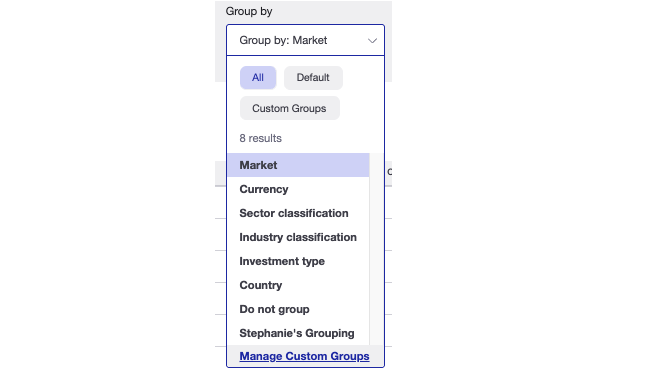
You also have the option of applying a custom grouping to your report. For example, you may wish to differentiate between individual equities, ETFs, managed funds and currency accounts, as seen in the screenshot below.
 A snippet of a historical cost report with holdings arranged by a custom grouping.
4. Export this report to share with your accountant
Another convenient feature of the historical cost report is the ability to share it with your accountant or financial adviser. To make this easier, Sharesight allows you to export the report to different file formats such as Google Sheets, XLS spreadsheet or PDF file.
Track your investment performance with Sharesight
Thousands of investors like you are using Sharesight to simplify their tax reporting and discover the true performance of their investments. What are you waiting for? Sign up today and:
-
Track all of your investments in one place, including stocks, mutual funds, property and even cryptocurrency
-
Automatically track your dividend and distribution income from stocks, ETFs and mutual funds
-
Run powerful reports built for investors, such as performance, diversity, contribution analysis, risk, exposure and future income (upcoming dividends)
-
Easily share portfolio access with family members, your accountant or other financial professionals so they can see the same picture of your investments as you do
Sign up for a FREE Sharesight account and get started tracking your investment performance (and tax) today.

Disclaimer: This article is for informational purposes only and does not constitute a specific product recommendation, or taxation or financial advice and should not be relied upon as such. While we use reasonable endeavours to keep the information up-to-date, we make no representation that any information is accurate or up-to-date. If you choose to make use of the content in this article, you do so at your own risk. To the extent permitted by law, we do not assume any responsibility or liability arising from or connected with your use or reliance on the content on our site. Please check with your adviser or accountant to obtain the correct advice for your situation.
FURTHER READING


Save time and money by sharing your portfolio with your accountant
It's easy to save time and money at tax time by sharing access to your Sharesight portfolio with your accountant. Keep reading to learn more.


Morningstar analyses Australian investors' top trades of FY26
Morningstar analyses Australian Sharesight users' top trades of FY25/26. Keep reading to see some of the most notable picks from the year.

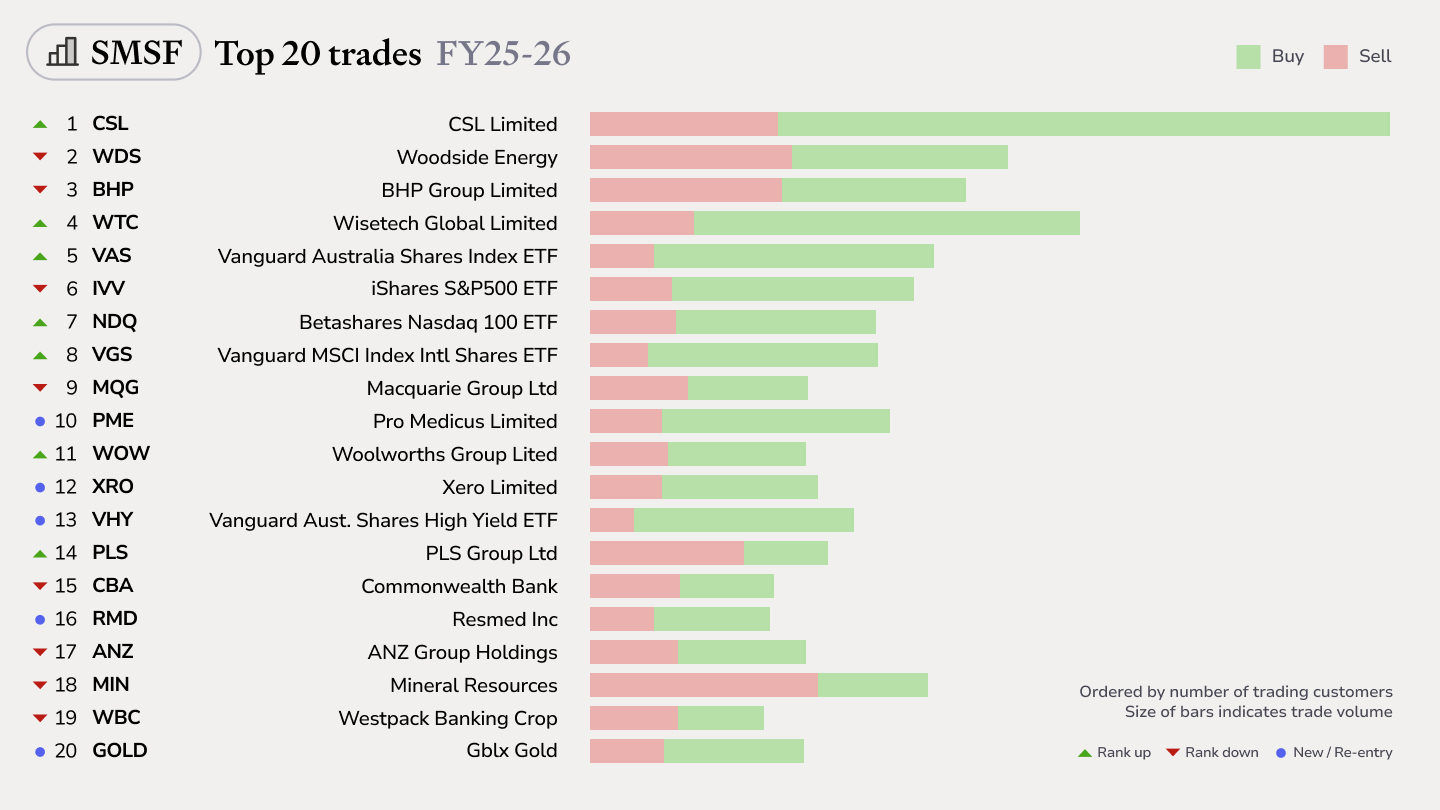
Top SMSF trades by Australian Sharesight users in FY25/26
Welcome to our annual Australian financial year trading snapshot for SMSFs, where we dive into this year’s top trades by Sharesight users.