Learning the pitfalls of portfolio (mis)management
I almost had to forfeit the spoils of a national share-picking competition in high school economics. True story. Representing a suburban-Chicago region of the state of Illinois, my team consisted of a group of simultaneously know-it-all, semi-capable, and lazy adolescent males. A toxic combination if there ever was one. We loafed our way through the competition with a couple of decent ideas drawn from our life experience (sport and video gaming) but won with a lucky all-in bet on Disney (DIS) in the final days. The market was in the midst of dot com mania and Disney had just purchased ESPN and like Tony Soprano’s ducks or Warren Buffett’s boats, we rode the rising tide.
The assignment required us to manage our portfolio properly, record transactions, dividends, fees, etc., all by hand, in order to teach us basic portfolio mathematics, the glory of compounding, and the benefits of buy and hold. We had done none of this. We explained to the girls in the class that we were future Wall Street Masters of the Universe due to our risk-loving, swashbuckling ways, and one day we’d have departments of people doing this for us. Fortunately, we were forced to submit our transactions along the way to the teacher so she could act as ombudsman. We were announced as the regional winner, but had to accurately match our recorded return with the teacher’s. Essentially, we had to explain why we won. Uh oh.
Looking back and trying to recreate portfolio performance or reconstruct trade histories is a terribly difficult thing to do. If you know your opening balance come the start of a new financial year, you’re in luck -- as long as that opening balance is 100% accurate. This process is not as simple as going back to find out what the price was on the day you bought the shares in order to compare it to today’s price. Take for example, the same investment scenario, but drawn from three different sources.
Buy 100 shares of BHP Billiton on 3 July, 2012 and calculate performance on 3 July, 2013:
- Google Finance, return = -1.69%
- ASX (MyASX Watchlist), return = -1.10%
- Sharesight, return = -2.91%
You may think these figures aren’t all that different, but when you use higher balances, multiple holdings, and a longer time period, the returns get very different, very quickly. For example, if you extrapolate these returns out three years:
- Google Finance, balance = $2,112
- ASX (MyASX Watchlist), balance = $1,693
- Sharesight, return = $1,515
That’s nearly a 30% difference in returns between Google and Sharesight. There’s absolutely nothing wrong with the way Google or ASX is calculating their figures, it’s just that they’re “point-to-point” and they’re not factoring in personal details like brokerage fees, dividends, franked amounts, and taxation rates. If you use Sharesight, you can be confident that all your portfolios will be treated to the same calculation methodologies, and you can sync all future trades so you don’t need to worry about any manual data entry.
In the end, my share-picking team and I had to stay up all night, entering data for each trading day so we could accurately reflect our return profile. We got our figures close enough, but it wasn’t worth the free t-shirt.
This information is not a recommendation nor a statement of opinion. You should consult an independent financial adviser before making any decisions with respect to your shares in relation to the information that is presented in this article.

Sharesight product updates – February 2026
This month's key focus was on the rollout of the new Investments tab to all users, along with various enhancements across web and mobile.

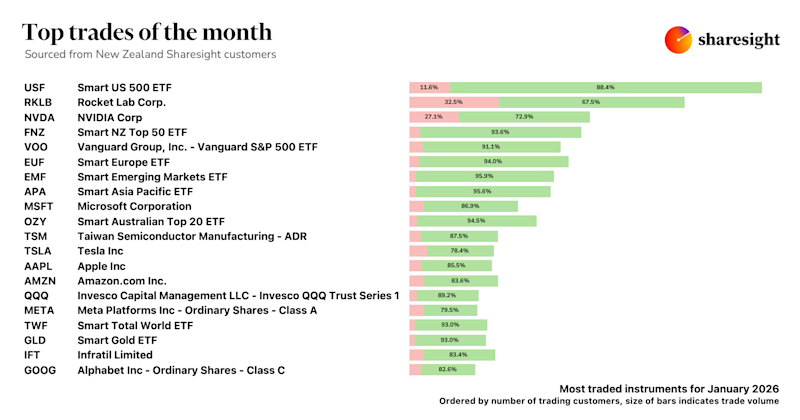
Top trades by New Zealand Sharesight users — January 2026
Welcome to the January 2026 edition of our trading snapshot for New Zealand investors, where we look at the top 20 trades made by New Zealand Sharesight users.

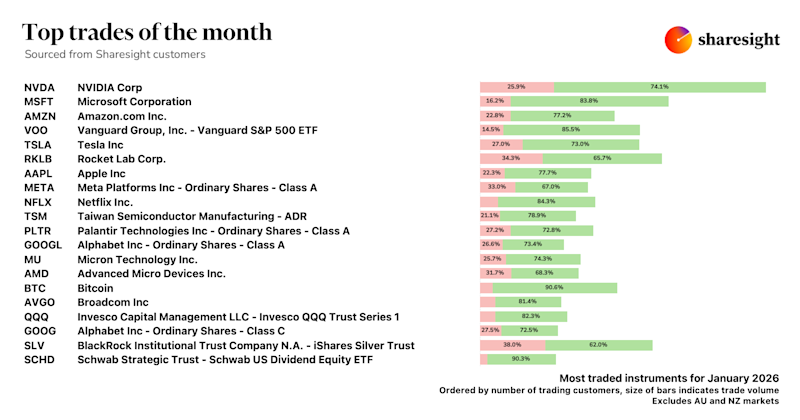
Top trades by global Sharesight users — January 2026
Welcome to the January 2026 edition of Sharesight’s trading snapshot for global investors, where we look at the top 20 trades made by Sharesight users globally.