How to track exchange-traded funds (ETFs)
While individual stocks have traditionally made up the bulk of investors’ portfolios, exchanged-traded funds (ETFs) have become increasingly popular in recent years, as they allow investors to add diversity to their portfolio in a single trade. According to Australian ETF provider Betashares, the end of 2023 marked a significant milestone for ETFs, with two million Australian investors holding ETFs in their portfolios. June 2024 also marked a record high for the industry, with $200 billion in total assets under management.
As with all investments, it’s crucial to track the performance of ETFs in your portfolio. In this article we will discuss the history of ETFs, some of the tax considerations for investors and how you can track the performance of your ETFs with Sharesight.

History of ETFs
There is some contention over which ETF counts as the first ETF in history. However, the concept of using a listed investment trust structure as a vehicle to invest in a broad range of underlying stocks gained traction in the early 1990s, with the launch of the S&P 500 Trust ETF “SPDR” (NYSE: SPY) on January 22 of 1993.
Initially, ETFs followed in the footsteps of the SPDR ETF, allowing investors to gain exposure to a fund that sought to replicate the performance of a ‘passive’ market index like the S&P 500. Over time, fund managers added “smart beta” (seeking to replicate an ‘alternative’ index) and “active” (actively managed by a fund manager with a strategy aiming to beat the market) ETFs to their offerings, further blurring the lines between managed funds and exchange-traded funds.
If you’re considering investing in ETFs, we also have a guide on what to look for when buying ETFs.
Tracking ETF performance
ETFs have an open-ended structure. This means that when investors seek to purchase additional units of the fund, the fund manager (or issuer) can issue additional units to the exchange. This means that unlike listed investment companies that can trade significantly above or below their Net Asset Value (NAV), ETFs trade at a unit price close to the value of the underlying assets each unit holds. And unlike managed funds, which can have opaque price discovery, tracking the performance of ETFs is much like any other stock, because ETFs are listed (and traded) on stock exchanges.
ETF tax considerations
Tracking the performance of your ETF investments is just one piece of the puzzle; managing the tax implications is the other. ETFs are a unitised trust structure that hold a number of underlying assets that each have their own tax implications for distributions earned by the ETF. The tax implications will vary by region. For example, in the US, distributions earned by the ETF are typically treated as ‘ordinary dividends’ and taxed accordingly, whereas in Australia most ETFs use the Attribution Managed Investment Trust (AMIT) structure and are a tax nightmare. ETFs also create complexity for UK investors, as depending whether the ETF has reporting status or not, or whether it was purchased through an ISA or SIPP, this can have significant implications on how it is taxed.
How to track ETFs in Sharesight
With support for over 750,000 stocks, ETFs and managed funds across more than 60 global stock exchanges, it’s easy to track ETFs along with the rest of your investments in Sharesight. Here’s how to add an ETF to your Sharesight portfolio(s):
- If you’re not already using Sharesight, sign up for a free account.
- You can add an ETF to your portfolio(s) by manually adding a trade and searching for the ETF’s name in the relevant market (eg. ASX: NDQ). You can also bulk upload trades to your portfolio via spreadsheet.
Note: Sharesight converts the prices and valuations of your holdings from their listed market to your portfolio’s base currency. It also automatically calculates any currency fluctuations on a daily basis and backfills past dividends and distributions (and continues to add new ones as they are announced).

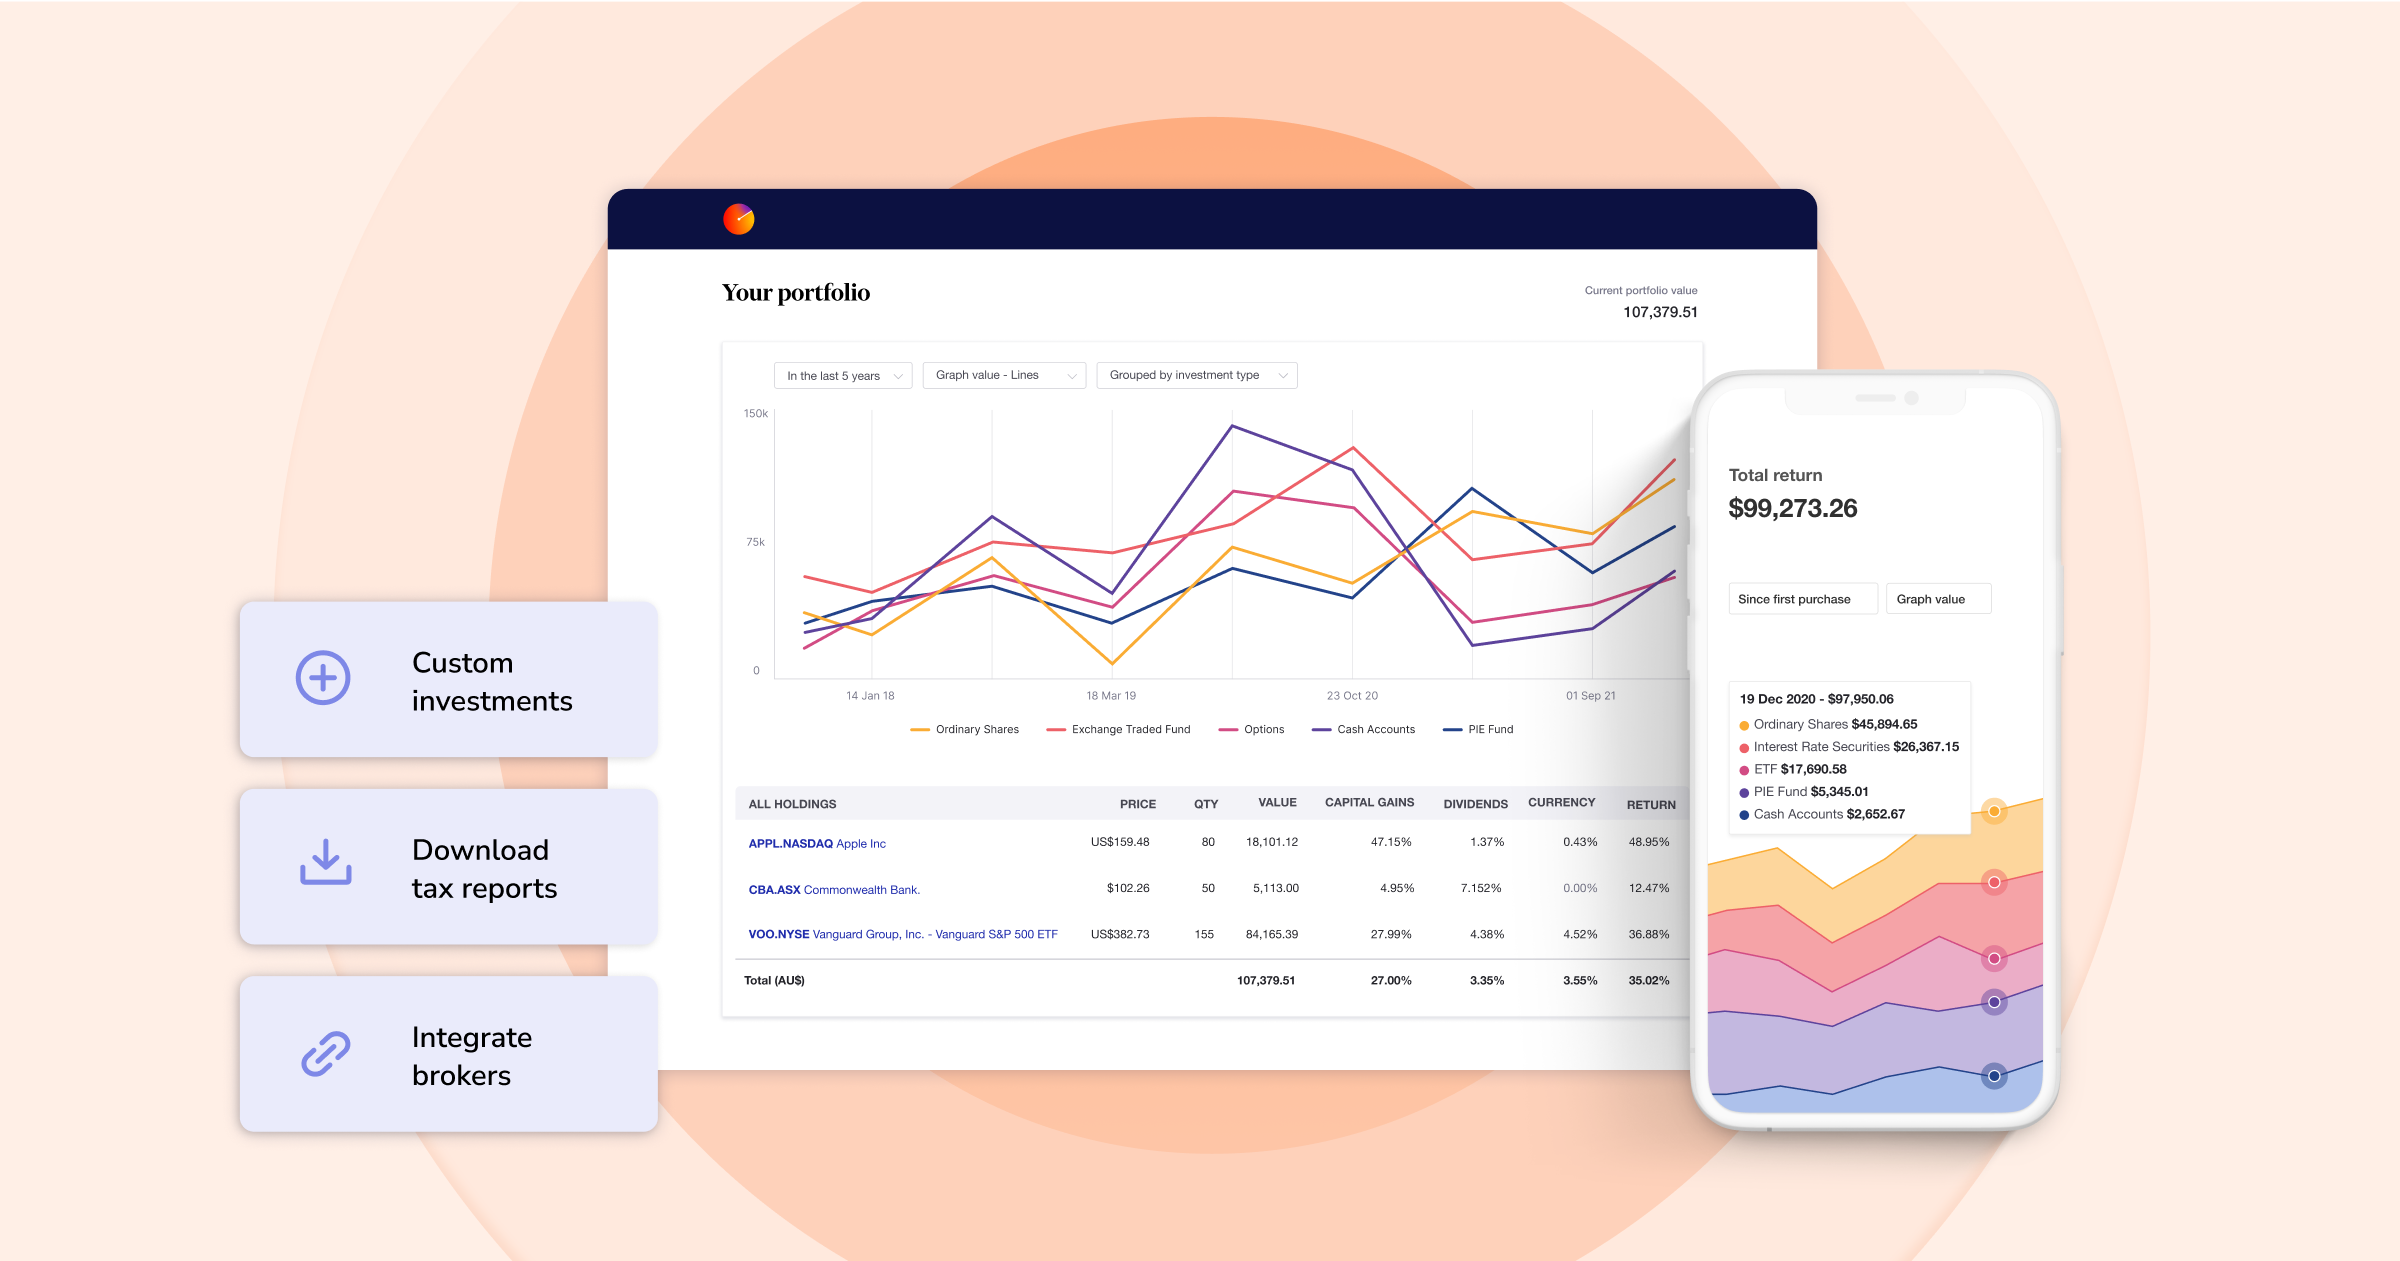
With Sharesight, investors can clearly see the impact of capital gains, dividends foreign currency fluctuations on the performance of their ETFs.
See what’s inside your ETFs with the exposure report
When investing in ETFs, it’s important to understand what’s inside those ETFs and whether there is any overlap between the various ETFs you hold or the other stocks in your portfolio. Available to investors on the starter, investor and expert plans, Sharesight’s exposure report is an easy-to-use tool that reveals your portfolio’s exposure to different industries, investment types and sectors by listing your direct stock holdings alongside any stocks held within exchange-traded funds (ETFs). This allows you to make informed decisions about your portfolio’s composition.

An example of a portfolio that holds AAPL as a direct share on the Nasdaq, as well as within two different ETFs.
Want more information?
For more information on how ETF investors can get the most out of Sharesight, see the video below where we demonstrate how you can use features such as the share checker, benchmarking tool, exposure report and tax reporting tools:
Benchmark your portfolio against an ETF
Exchanged-traded funds make for excellent portfolio benchmarks because they take into account all the inner workings of a real portfolio, including fees, dividends and any franking credits that may apply. With Sharesight, you can benchmark against ETFs as well as any of the 750,000+ managed funds, trusts or stocks that Sharesight supports.
 An example of a portfolio with a high concentration of US tech stocks benchmarked against the Betashares Nasdaq 100 ETF.
To select an ETF as a benchmark, simply click ‘Add a benchmark’ on the portfolio’s Overview page. You can either select from a common ETF benchmark or type in the market code and select the ETF of your choice.
Track your ETFs (and the rest of your portfolio) with Sharesight
Join hundreds of thousands of global investors using Sharesight to track their ETFs along with the rest of their investments. Sign up for Sharesight so you can:
- Track all your investments in one place, including over 750,000 global stocks, ETFs, mutual/managed funds, property and even cryptocurrency
- Automatically track dividends and distributions from stocks, ETFs, LICs, and mutual/managed funds – including the value of franking credits
- Calculate your dividend income with the taxable income report
- Run powerful reports built for self-directed investors, such as performance, portfolio diversity, contribution analysis, exposure, multi-period and multi-currency valuation
Sign up for a FREE Sharesight account and get started tracking your investment performance (and tax) today.

FURTHER READING

8 ways to use Sharesight's custom groups feature
This blog explains our custom groups feature, including strategies that can help you gain deeper portfolio insights and make more informed investing decisions.

You can time the market – and ETFs are the way to do it
Marcus Today founder and director Marcus Padley discusses timing the market, and how investors can do this using exchange-traded funds (ETFs).

Morningstar analyses Australian investors’ top trades: Q1 2025
Morningstar reviews the top 20 trades by Australian Sharesight users in Q1 2025, and reveals where their analysts see potential opportunities.