How to interpret the P/E ratio
The Price to Earnings (P/E) ratio is one of the many investment metrics Sharesight displays on stocks to help investors make better investing decisions. Investors and analysts alike often use this metric to determine whether a stock’s price is of fair value. To learn more about the different types of P/E ratios and how to interpret them as an investor, keep reading.

What is the P/E ratio?
The P/E ratio is a widely used measure of stock valuation and is generally based on the most recent price divided by the earnings per share (EPS) of a company. Investors can use the P/E ratio to assess a stock’s relative value against the current market price, which allows them to find opportunities to trade when these values diverge significantly.
How to interpret different types of P/E ratios
The P/E ratio can hide a number of subtleties, which are important to understand if you are going to make use of this ratio.
1. Unadjusted historical P/E
This is the P/E ratio figure the ASX produces and is displayed in Sharesight for stocks listed on this particular exchange. It is the most basic version and takes the reported EPS of the last two 6-month reporting periods and is divided into the current price. It is generally sufficient, but the limitation is that it is backward looking and doesn’t adjust for one-off "abnormal earnings" which might skew the results up or down for one particular year.
2. Forward P/E
This is what most research analysts will show in their reports. This takes the forecast current year earnings (as predicted by the analyst) and is divided into the current price. This has the benefit of being forward looking, which is more important to the stock price. It will also usually adjust for abnormals. However, it has the downside that it is based on a prediction which can be (and frequently is) wrong. It’s not easy to predict the future!
3. Time-weighted adjusted P/E
This is a variation of the two which Morningstar still uses and which I quite like (I was a co-developer of it). It takes the average of consensus forecasts and the last actual and weighs it by the time elapsed from the last actual to the next year end. It also adjusts for abnormals. It tends to produce more balanced P/Es which are easier to compare with each other and less subject to short-term swings.
In short – understand what you’re looking at when interpreting P/E ratio data.
Start tracking your performance with Sharesight
Thousands of investors like you are already using Sharesight’s portfolio tracker to manage their investment portfolios. What are you waiting for? Sign up and:
-
Track all of your investments in one place, including stocks, ETFs, mutual/managed funds, property and even cryptocurrency
-
Automatically track your dividend and distribution income from stocks, ETFs and mutual/managed funds
-
Run powerful reports built for investors, including Performance, Portfolio Diversity, Contribution Analysis, Future Income and Multi-Currency Valuation
-
See the true picture of your investment performance, including the impact of brokerage fees, dividends, and capital gains with Sharesight’s annualised performance calculation methodology
Sign up for a FREE Sharesight account and get started tracking your investment performance (and tax) today.
Andrew Bird
Andrew Bird is Chairman and a shareholder of Sharesight, an online portfolio tracking tool for investors and financial professionals. Prior to joining Sharesight, he was the CEO of Morningstar Australia and NZ. He joined Morningstar in 2006 after it acquired Aspect Huntley, an online equities research and information business he co-founded in 1997.Disclaimer: The above article is for informational purposes only and does not constitute a product recommendation, or taxation or financial advice and should not be relied upon as such. Always check with your financial adviser or accountant to obtain the correct advice for your situation.
FURTHER READING

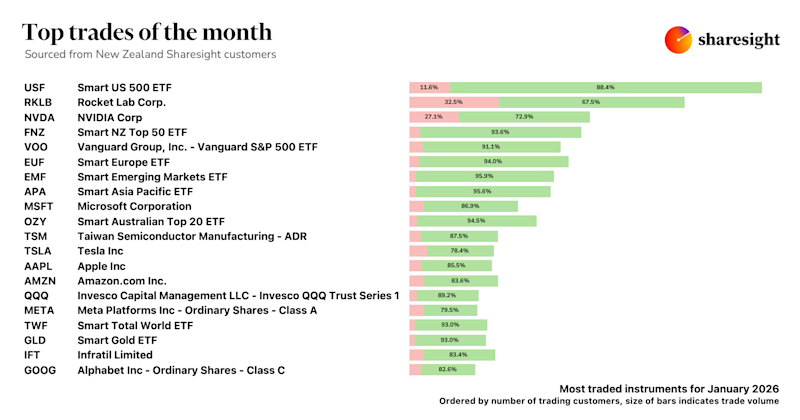
Top trades by New Zealand Sharesight users — January 2026
Welcome to the January 2026 edition of our trading snapshot for New Zealand investors, where we look at the top 20 trades made by New Zealand Sharesight users.

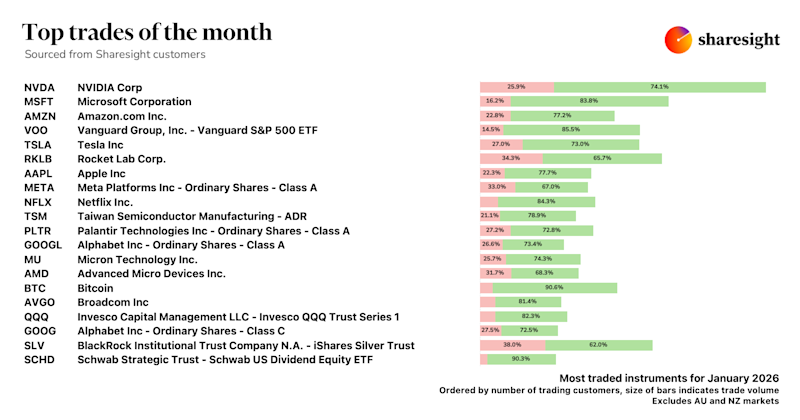
Top trades by global Sharesight users — January 2026
Welcome to the January 2026 edition of Sharesight’s trading snapshot for global investors, where we look at the top 20 trades made by Sharesight users globally.

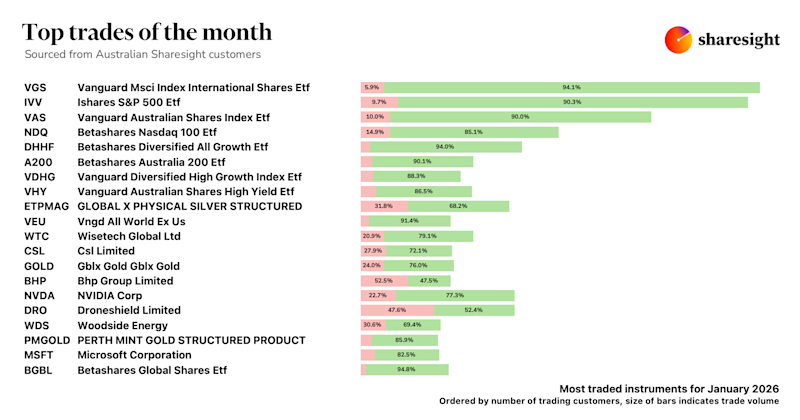
Top trades by Australian Sharesight users — January 2026
Welcome to the January 2026 edition of our trading snapshot for Australian investors, where we look at the top 20 trades made by Australian Sharesight users.