How to calculate portfolio turnover
Typically used by fund managers, portfolio turnover is a metric that expresses the level of trading activity in a portfolio of investments. As a self-directed investor, you can also apply this metric to your personal investment portfolio as a way to better understand your investment strategy and the profitability of your portfolio. To learn more about portfolio turnover and how you can calculate this using Sharesight, keep reading.

What is portfolio turnover?
Portfolio turnover is a measure of how frequently the underlying investments within a managed/mutual fund are bought and sold by the fund manager, usually over a one-year period. As a self-directed investor, if you consider your own portfolio like a fund that you manage, you can calculate the turnover ratio the same way a fund manager does to get insights into your portfolio’s performance.
Why is portfolio turnover ratio an important measure?
When it comes to investing in actively managed funds, funds that have a high turnover ratio also tend to have higher fees, driven by the costs of turning over their portfolios. When applied to an individual investor, it reflects increased costs due to transaction fees, which eat into the portfolio’s returns.
A low portfolio turnover ratio, on the other hand, indicates more of a buy and hold investing strategy than an active investing strategy. This also suggests lower transaction fees for the portfolio. From an after-tax perspective, it’s important to keep portfolio turnover low.. When your portfolio turnover is high, the after-tax result can be much worse than what the pre-tax number suggests. This is because every time you sell a stock (at a profit) to buy another, you incur a tax. Over time, these charges add up.
In general, your portfolio turnover ratio is a leading indicator of how much profit your portfolio actually generates.
How to calculate portfolio turnover
The formula for the portfolio turnover ratio is as follows:
Portfolio turnover ratio is the minimum of assets bought or sold in dollar amounts, divided by the monthly average valuation of the portfolio over the last year.
Where:
-
The minimum of securities bought or sold refers to the total dollar amount of new securities purchased or the total amount of securities sold (whichever is less) over a one-year period.
-
Average net assets refers to the monthly average dollar amount of net assets in the fund.
As an example, let’s assume that your portfolio began a period with $100,000 in assets and then over the course of a year, you added $11,000 worth of stocks, and sold $12,000 worth of assets. For the average net assets, let’s assume that the portfolio was worth $100,000 on average. In that case, the turnover of the portfolio is $11,000/$100,000 = 11%.
How to calculate portfolio turnover using Sharesight
In Sharesight, there are two important reports that will help you calculate your portfolio’s turnover.
All trades report
The all trades report allows you to view your trading history at a glance over any chosen period. The report lists all buy and sell trades made over the selected date range, with the ability to classify trades by market, currency, country, and a range of other factors.
Since the period that’s most relevant for our calculation purposes is one year, you can choose this period using the date filter. Once you have selected the period and have a list of all your transactions over this period, you can add all the buy and sell trades to see which number is lower.
Multi-currency valuation report
The multi-currency valuation report (available on Expert plans) shows you the valuation of your portfolio in the currency of your choice, at any given date. While this report is designed for global investors who wish to see the value of their portfolio in different currencies, investors can also use it to find their average portfolio value in a given year. To do this, simply record the value of your portfolio on the same date each month over a 12 month period and take the average of these figures.
The ratio of the numbers obtained from the above two reports will give you the portfolio turnover ratio.
Track your portfolio's performance with Sharesight
Join thousands of investors already using Sharesight to manage their investment portfolios. With Sharesight you can:
-
Track all of your investments in one place, including stocks, ETFs, mutual/managed funds, property and even cryptocurrency
-
Automatically track your dividend and distribution income from stocks, ETFs and mutual/managed funds
-
Run powerful reports built for investors, including Performance, Portfolio Diversity, Contribution Analysis, Multi-Period and Multi-Currency Valuation
-
Easily share access of your portfolio with family members, your accountant or other financial professionals so they can see the same picture of your investments as you do
Sign up for a FREE Sharesight account and get started tracking your investment performance (and tax) today.
Disclaimer: The above article is for informational purposes only and does not constitute a specific product recommendation, or taxation or financial advice and should not be relied upon as such. While we use reasonable endeavours to keep the information up-to-date, we make no representation that any information is accurate or up-to-date. If you choose to make use of the content in this article, you do so at your own risk. To the extent permitted by law, we do not assume any responsibility or liability arising from or connected with your use or reliance on the content on our site. Please check with your adviser or accountant to obtain the correct advice for your situation.
FURTHER READING

Sharesight product updates – February 2026
This month's key focus was on the rollout of the new Investments tab to all users, along with various enhancements across web and mobile.

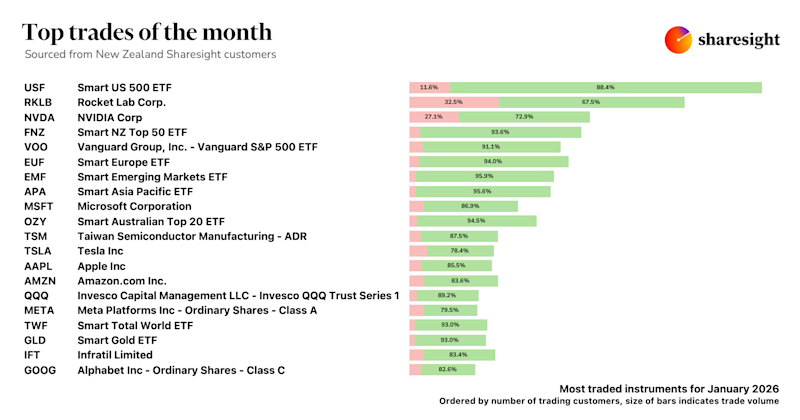
Top trades by New Zealand Sharesight users — January 2026
Welcome to the January 2026 edition of our trading snapshot for New Zealand investors, where we look at the top 20 trades made by New Zealand Sharesight users.

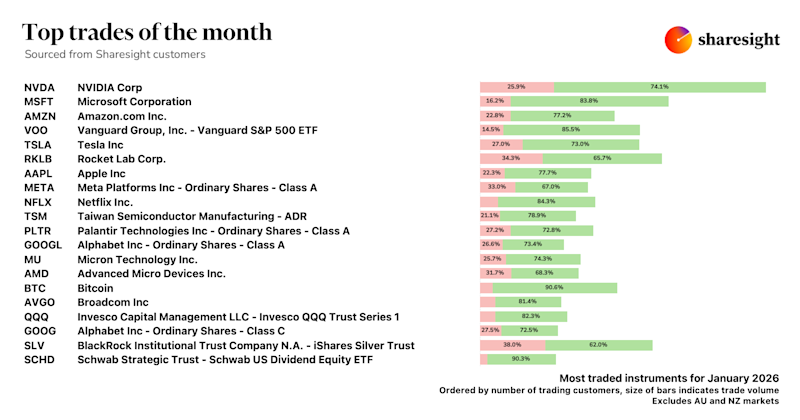
Top trades by global Sharesight users — January 2026
Welcome to the January 2026 edition of Sharesight’s trading snapshot for global investors, where we look at the top 20 trades made by Sharesight users globally.