How to build a long-term portfolio in listed markets
The idea that a bell rings to signal when investors should get into or out of the market is simply not credible. After nearly 50 years in the business, I do not know of anyone who has done it successfully and consistently.
Jack Bogle, Founder of Vanguard
Charlie and I spend no time thinking or talking about what the stock market is going to do, because we don’t know. We are not operating on the basis of any kind of macro forecast about stocks. There’s always a list of reasons why the country will have problems tomorrow.
– Warren Buffett
Let’s face it. If the two most distinguished investors of the last 50 years don’t have a clue what markets will do, the rest of us are fooling ourselves.
The finance industry makes investing complicated by giving too many false promises. Market experts speculate about when to buy and sell shares as if they have special insights, when every day there are a multitude of contradicting opinions. Fund managers say they will deliver outperformance through their superior knowledge, but they are competing against equally-talented analysts and all will struggle to match the index over time after fees.
The result is that many investors chop and change their strategies based on guesswork, especially responding to the media tendency to over-hype market falls with panicky headlines. A National Seniors Australia Report in 2018 called ‘Once Bitten, Twice Shy’ found that 23% of retirees cannot tolerate a loss on their retirement savings in any 12-month period, and only 10% could suffer a loss of 10% of higher.
Yet since the Second World War, there have been 40 times where the All Ords Price Index has fallen 10% or more, or about once every two years. Worse, it has fallen over 50% three times, in 1987, 1974 and 2007 to 2009. It will happen again, and investors should be ready in advance.

These falls cause investors to panic and sell at the worst time when they can no longer accept the pain. Then as the market recovers, they regain confidence and buy at higher levels. This regular pattern of buy high/sell low means the average investor does not even achieve the market index.
In any case, we spend too much time on selecting stocks. An estimated 90% of the return from a portfolio comes from the mix of asset classes, not the share selection. Even if someone has a special talent for picking shares, it matters little for the overall portfolio performance if the asset allocation between cash, property, bonds, domestic and global shares and other alternatives is inappropriate.
A better long-term strategy than jumping in and out of markets is to select a portfolio that suits you based on a few simple principles: goals, risk appetite, diversification and cost management.
1. Consider your goals
A Millennial saving for a home deposit over five years has a different investment profile than a Baby Boomer funding a 30-year retirement. If a reasonable assessment of likely returns and savings patterns shows a goal cannot be achieved, then it might be necessary to work longer or save more. Each person is different, but starting early and tapping into the wonders of compounding will pay off.
2. Assess your appetite for investment risk
A test of your risk appetite is how well you will sleep at night if your portfolio falls in value. Your risk capacity may vary according to:
- Your investment horizon
- Your age and stage of life
- Your knowledge about investing.
Perhaps take some financial advice to assist in assessing your risk profile, then leave your money there and don’t be tempted to swap styles.
3. Select an asset allocation that matches your risk appetite
A broadly-diversified portfolio using a variety of asset classes is a good investment solution for the majority of people. Consider the three portfolios below. Choose a more conservative mix if you are risk averse or older and worry about the value of your investments falling. If you’re under 50, a more aggressive portfolio may be suitable since you have time to invest more and better capacity to ride out the inevitable share market volatility.
These portfolios change the allocation from ‘growth’ to ‘income’ assets depending on risk appetite. The distinction (growth v income) depends on where most of return expected.
Example asset allocations at various risk levels
| Conservative | Balanced | Aggressive | |
|---|---|---|---|
| Risk horizon | 2 years | 5 years | 8 years |
| Australian shares | 6 | 20 | 30 |
| Global shares | 6 | 20 | 35 |
| Listed property | 3 | 5 | 10 |
| Australian bonds | 30 | 20 | 10 |
| Global bonds | 20 | 10 | 5 |
| ‘Alternatives’ | 5 | 5 | 5 |
| Cash | 30 | 20 | 5 |
| TOTAL | 100 | 100 | 100 |
| Growth Assets | 20 | 50 | 80 |
| Income Assets | 80 | 50 | 20 |
4. Manage your costs
While you cannot control the market, you have more influence over what costs you pay. The three major costs to watch are:
- Investment management fees
- Administration fees such the cost of an investment ‘platform’
- Financial advice fees.
One way to reduce investment management costs is to invest in index funds, but this removes the possibility of outperformance from selecting a talented manager. Platform fees might be reduced by using securities listed on the ASX, and with $40 billion in Exchange-Traded Funds (ETFs) and $40 billion in Listed Investment Companies (LICs) and Trusts (LITs), there are now plenty to choose from to gain the required exposure, as shown below.
This article focusses on the ASX listed market, but there are plenty of institutions who actively manage balanced portfolios for a reasonable cost.
Assembling a portfolio using listed securities
A complete list of investment products on the ASX is here. It includes hundreds of ETFs, LICs, LITs, A-REITs, infrastructure funds, unlisted funds on the mFund service, and alternatives such as currency, infrastructure, gold and absolute return funds.
Exposure to the seven asset classes identified in the table above can be achieved in many combinations, and the following are among the more popular (with their ASX code):
Cash
AAA: BetaShares Australian High Interest Cash ETF
MONY: UBS IQ Cash ETF
BILL: iShares Core Cash ETF
Australian shares
A200: BetaShares Australia 200 ETF
STW: SPDR 200 Fund ETF
VAS: Vanguard Australian Shares ETF
AFI: Australian Foundation Investment (Active)
Global shares
MGG: Magellan Global Trust (Active)
PMC: Platinum Capital (Active)
IVV: iShares S&P500 ETF
VGAD: Vanguard International Shares (Hedged) ETF
Australian listed property
VAP: Vanguard Australian Property Securities Index ETF
SLF: SPDR S&P/ASX200 Listed Property Fund ETF
MVA: VanEck Vectors Australian Property ETF
Plus an enormous range of A-REITs such as WFD: Westfield, SGP: Stockland, MGR:Mirvac and CQR: Charter Hall.
Australian bonds
VAF: Vanguard Australian Fixed Interest ETF
BNDS: BetaShares Legg Mason Australian Bond Fund (Active)
FLOT: VanEck Vectors Australian Floating Rate ETF
QPON: BetaShares Australian Bank Senior Floating Rate Bond ETF
Global bonds
VBND: Vanguard Global Aggregate Bond Index (Hedged) ETF
IHCB: iShares Core Global Corporate Bond ETF
‘Alternatives’
HBRD: BetaShares Active Hybrid Fund (Active)
ALI: Argo Global Listed Infrastructure (Active)
TOP: Thorney Opportunities Limited (Active)
GLIN: AMP Global Infrastructure (Active)
There are also infrastructure stocks such as SYD: Sydney Airport, TCL: Transurban Group and SKI: Spark Infrastructure Group which can be put in the alternatives bucket.
A sample low cost, balanced portfolio using listed securities
Among a myriad of choices too numerous to list, a sample portfolio based on the above might look like the following table, with the management expense ratio (MER) included. The example seeks to minimise fees, but this approach is not a recommendation. More important is the net return after fees, and if an investor likes an active fund or manager, and believes they can outperform and cover their higher fees, it might be a better choice.
| Asset Class | Example ASX code | Balanced Allocation | MER |
|---|---|---|---|
| Australian shares | A200 | 20% | 0.07% |
| Global shares | IVV | 20% | 0.07% |
| Listed property | VAP | 5% | 0.25% |
| Australian bonds | BOND | 20% | 0.24% |
| Global bonds | VBND | 10% | 0.20% |
| ‘Alternatives’ | Mix of HBRD, GLIN | 5% | 0.75% |
| Cash | AAA | 20% | 0.18% |
| TOTAL | 100% | 0.18% |
This is a balanced portfolio with an annual MER less than 0.2% (20 basis points) plus the cost of brokerage but with no separate platform fee.
The portfolio focuses only on cost, but in a core-satellite approach, an active fund manager could be added to give greater outperformance potential.
What about the record-keeping?
If the investments are not held on a platform, how is the portfolio monitored?
There are better ways than relying on an Excel spreadsheet. For many years, I have used Sharesight to monitor my personal portfolio, including automatic updates of ASX transactions, comprehensive tax and performance reporting, and good visuals. I give my accountant direct access to my account for preparation of my personal tax return.
I don’t consider Sharesight an alternative to the full-service of a specialist administrator for my SMSF, as that has specific legal obligations for me as a trustee and a complexity I want in the hands of SMSF experts. But I keep my SMSF records on Sharesight, as well as my personal portfolio, as a check.
Sharesight has not paid me to say this. It’s simply a fact that I maintain my share records there.
Think long term and turn down the noise
Investing should be part of a multi-decade plan. Turn down the volume of the daily market noise and unless you enjoy it or have special skills, don’t waste too much time on picking individual shares or trying to time the market. The experts don’t know about the near-term direction of the market, and neither do you. It’s the high-level asset allocation that will mainly drive your returns.
Graham Hand is Managing Editor of the Firstlinks Newsletter, a leading independent financial journal. A free subscription for Sharesight clients is available here. This article is general information and does not consider the circumstances of any investor.
FURTHER READING

Sharesight product updates – February 2026
This month's key focus was on the rollout of the new Investments tab to all users, along with various enhancements across web and mobile.

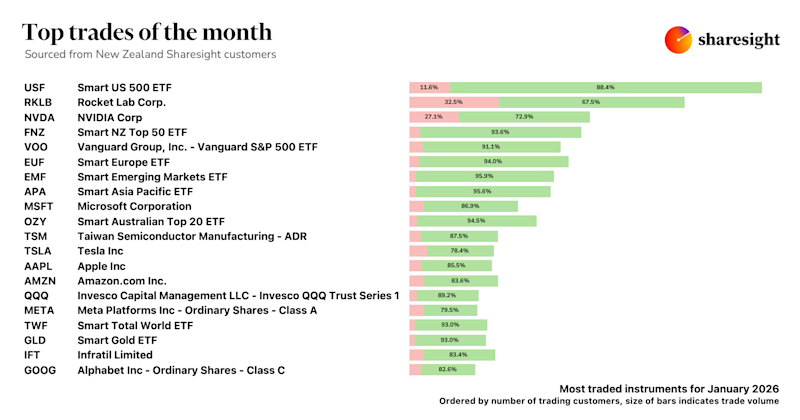
Top trades by New Zealand Sharesight users — January 2026
Welcome to the January 2026 edition of our trading snapshot for New Zealand investors, where we look at the top 20 trades made by New Zealand Sharesight users.

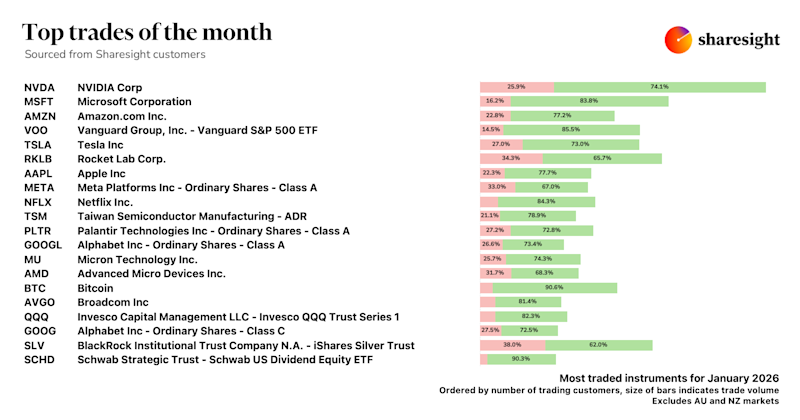
Top trades by global Sharesight users — January 2026
Welcome to the January 2026 edition of Sharesight’s trading snapshot for global investors, where we look at the top 20 trades made by Sharesight users globally.