How Sharesight calculates your investment performance
Sharesight is built by self-directed investors for the needs of fellow investors. By taking into account the impact of things like dividends, currency fluctuations and the timing of inflows and outflows on your investment portfolio, we provide a true view into your investment performance.
In this article we’ll explore in more detail how Sharesight calculates your investment performance and some of the ways we help give you the full picture of your portfolio.

Factors Sharesight takes into account to calculate performance
Capital gains are only one component of your investment performance. Sharesight takes into consideration the following factors when calculating your total return:
Let’s take a moment to consider why each of these factors is important in giving you, the self-directed investor, the most accurate picture of your investment performance.
Component returns

There are three key components to your total return. They are capital gains, dividends and currency gains -- which are all annualised (see below).
Let’s briefly look at each.
Capital gain
In investing, capital is the money you have invested in a particular holding, therefore in Sharesight the capital gain figure reflects the gain (or loss) resulting from movements in the underlying unit/share price.
(Note: The capital gain figure in Sharesight can also include realised gains/losses on sales during the period, so it's not strictly just the change in the value of capital invested.)
Dividends
Dividends, also called distributions in the context of ETFs and managed/mutual funds are the income paid in return for being invested in a particular holding. It is important to consider this return as distinct from capital gains as many countries tax dividends differently to capital gains, in particular Australia, where franking credits may also apply.
Read our post on the 3 reasons why you need to be tracking dividends for more information.
Currency gain
Did you know that more than 30% of Sharesight users on paid plans in Australia invest internationally? This means for these investors foreign exchange fluctuations will ultimately impact investment returns, and for this reason every Sharesight portfolio has a ‘home’ country residency currency that all investments are valued in. This means that international investments where the currency differs from that of the portfolio residency are converted back to the home currency at the prevailing intraday foreign exchange rate (updated every 5 minutes) when calculating the portfolio’s performance. This is also used for tax reporting purposes.
In a technical sense, the currency gain figure reflects the gain (or loss) resulting from movements in the unit/share price, much like the capital gain figure.
Brokerage costs
While there are an increasing number of brokers with zero-commission trading, for most investors, brokerage costs eat into their investment returns, particularly when the trade size is small.
Brokerage fees, over the long term, can be surprisingly costly. For example, let’s say by trading with a lower cost broker, or buying larger parcels of shares less often, an investor saves $100 per year in brokerage. If that money saved was instead invested with a 7% return, that saving would compound to $10,200 over 30 years.
To measure the impact of brokerage costs on your investment performance, Sharesight allows you to record this cost against a transaction, adding to the cost base, or the purchase price for that holding.
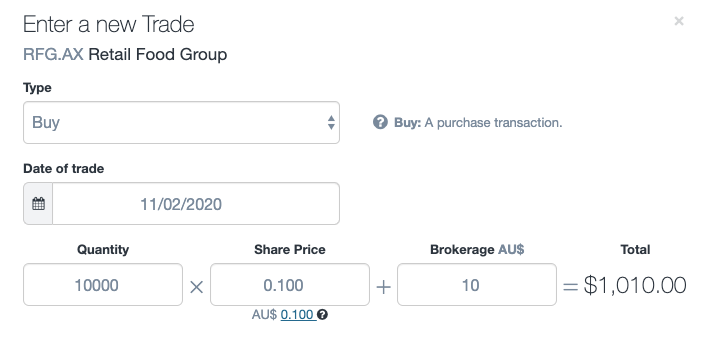
To illustrate this, let’s look at a scenario where an investor buys a parcel of shares worth $1,000 and the broker charges $10 to execute the trade for the investor.

When this $10 brokerage is added to the cost base of the shares, it will result in a cost base higher ($1,010) than the holding’s face value ($1,000), and if the investor then immediately sold this same parcel of shares (also paying brokerage on the sale) this will result in a capital loss.

How brokerage costs on the above buy trade impacted capital gain/total return
Calculating the impact of time
There are two distinct areas where Sharesight considers the impact of time on your investment returns. They are:
-
Annualisation
-
Timing/size of investment decisions
Why does Sharesight annualise returns?
Note: Portfolio annualisation only applies if you’ve held your shares for longer than one year. We apply a total return for investments held for less than one year.
As a tool for self-directed investors Sharesight calculates returns using an annualised performance methodology rather than simply stating the difference between the buy and sell (or current) price.
At its core, investors need to know how an allocation of capital has performed over the time that it has been invested. By incorporating the impact of time, it makes it easy to see not only your return, but your performance (rate of return).
One of the key benefits to this is that annualised performance makes it easy to compare the relative performance of investments (and your portfolio) over the same and different periods.
(We explore in further depth why non-annualised returns can be potentially misleading to investors in our blog post (with real-world examples) -- Cate Blanchett, queen of 100% investment returns?)
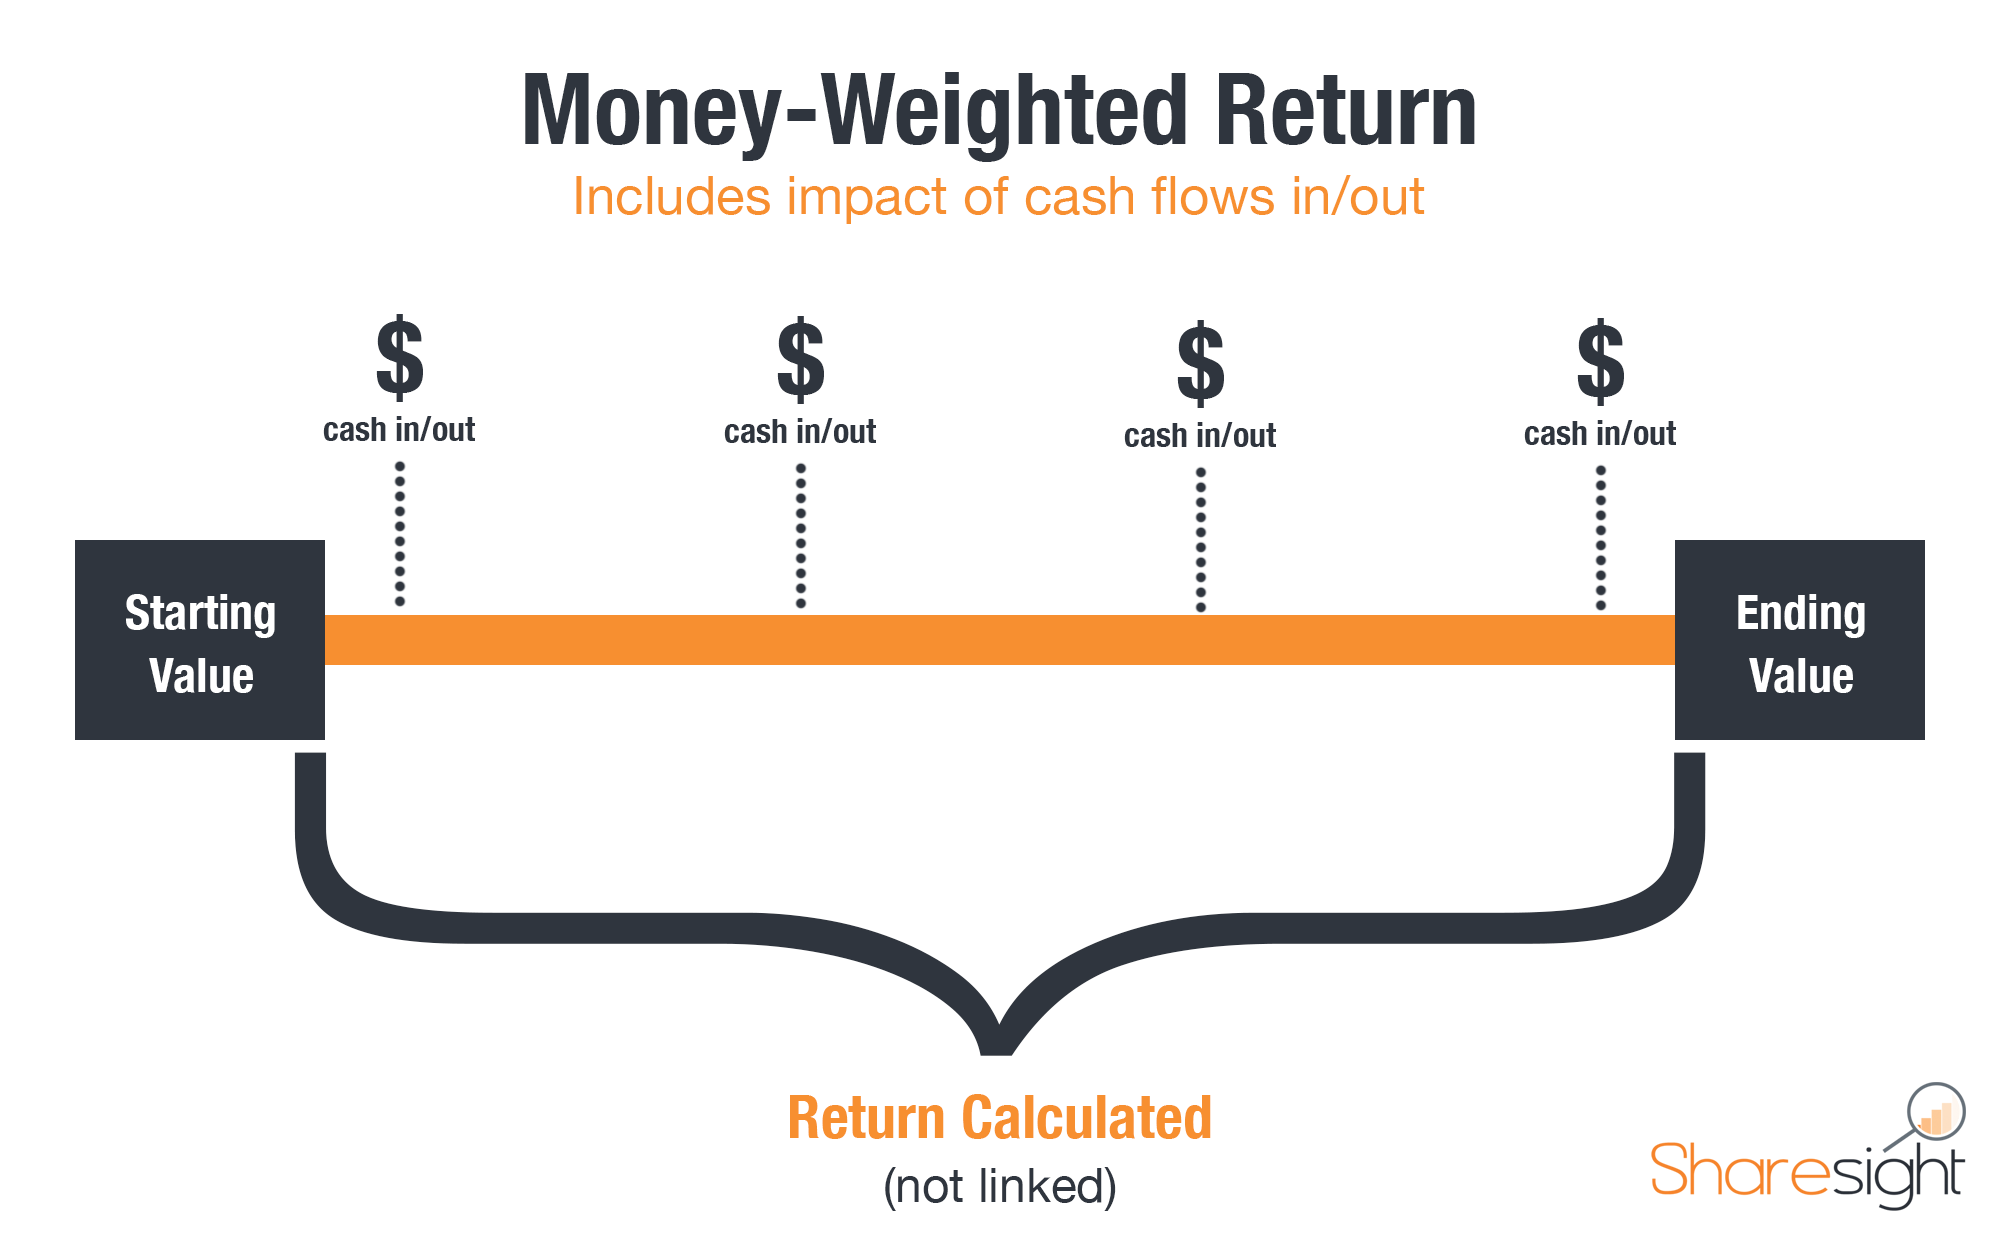
Money-weighted rate of return
The performance of individual shares or funds in your portfolio is not the sole determiner of your overall portfolio performance. Your decisions to buy (inflows) and sell (outflows) particular investments also contribute to the return you have achieved as an investor.
This is because you, the investor control both the size, and the timing of cash flows into and out of your investment portfolio. If you time your trades to buy low and sell high you can generate a higher return.
Thus you may be interested in determining how your decisions to buy (inflows) and sell (outflows) particular investments have contributed to the returns you have achieved as an investor.
For this reason Sharesight uses what is known as a money or dollar-weighted rate of return calculation that factors both the impact of the size of investments and when they occur. This differs from what is known as a ‘time-weighted rate of return’ which is commonly used by fund managers to determine their performance (because they, unlike you, do not have direct control over fund in/out flows).

For additional info, make sure to read our earlier blog post where we explain the difference between time-weighted and dollar-weighted rates of return.
Note: While there are various approaches to calculating money-weighted return, Sharesight uses a variation of the Modified Dietz method which has shown to provide a reasonable measure of performance even with large volatility of prices and periodical cash flows. See Sharesight’s performance calculation methodology for more information.
Simple vs Compound performance calculation method
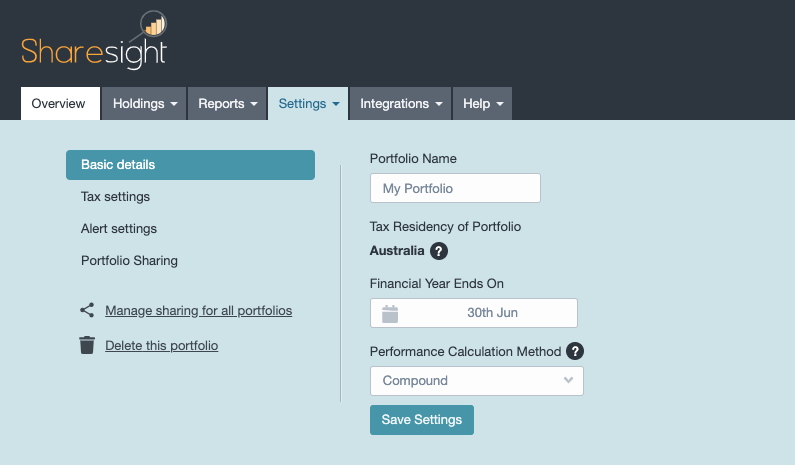
There are two common arithmetically correct ways to calculate returns, and they can give quite different results. These two methods are the compound annual growth rate (CAGR) and the simple annualised return, or ‘non-compounding’ method.
Both methods are valid, but users should be aware when setting up their portfolio that Sharesight allows you to choose which method to use when calculating your performance - as this choice will lead to different results. This setting is available in the portfolio settings tab, or when first creating a portfolio.

For an explanation of the difference between the two methods, read our blog post explaining simple vs compound performance calculations as well as our help page on our performance calculation method.
Sharesight gives you the complete picture of your investment portfolio
Not only does Sharesight use the above performance calculation methodology built specifically for the needs of self-directed investors like you, with Sharesight you can:
-
Automatically track your daily price & currency fluctuations, as well as handles corporate actions such as dividends and share splits
-
Run powerful reports built for investors, including Performance, Portfolio Diversity, Contribution Analysis and Future Income (upcoming dividends)
-
Plus run tax reports including Taxable Income (dividends/distributions), Capital Gains Tax (Australia and Canada), Traders Tax (Capital Gains for traders in NZ) and FIF foreign investment fund income reports (NZ)
If you haven’t already signed up for Sharesight, you can do so here, it’s free to get started!
FURTHER READING

Every feature Sharesight released in 2025
In case you missed any of our monthly updates, here’s a full recap of all the new Sharesight features and improvements released in 2025.

Sharesight product updates – December 2025
This month's key focus was on the launch of the Tasks tab, an improved Overview page, and additional support for 20,000+ bonds on the LSE.

Sharesight's top 10 investing blogs of 2025
We look back on your favourite Sharesight blogs, from Sharesight feature explainers to users' favourite brokers, a compilation of world's best blogs and more.