What is the Compound Annual Growth Rate (CAGR)?
The Compound Annual Growth Rate or CAGR is one measure of an investment’s annual growth rate over time, including the impact of compounding. It is one of several metrics that can be used by investors to measure and compare the past performance of investments or to project their expected future returns. Here we look at some of the advantages and disadvantages of this method.

What Is the Compound Annual Growth Rate (CAGR)?
A compound annual growth rate (CAGR) measures the rate of return for an investment — such as a mutual fund or bond — over any given investment timeframe. The CAGR is one of the most accurate ways to calculate and determine returns for any asset that can rise or fall in value over time. This metric is also known as a "smoothed" rate of return because it measures the growth of an investment as if it had grown at a steady rate on an annually compounded basis. Investors can then compare the CAGR of two or more investments within, or across different asset classes to assess how they performed against each other, or alternatively benchmark against the performance of a market index. This ability to evaluate performance across multiple investments can give the CAGR method an advantage over other rates of return.
What is the CAGR used for?
The CAGR is a mathematical formula that lets investors know what an investment yields on an annually compounded basis. It is widely considered to be the best formula for evaluating how different investments have performed over time. The CAGR can also be used to compare the historical returns of stocks to bonds or a savings account. However, it should be noted that the CAGR is only useful in comparing investments over the same time periods and does not reflect investment risk. CAGR assumes a constant growth rate across the period being assessed, by smoothing volatile or inconsistent investment growth, it’s much easier to compare different investments or to track the performance of a specific investment.
What is the CAGR formula?
To calculate the CAGR, an investor essentially just needs three data points: the beginning value of the investment; the end value of the investment; and the number of years of the investment was held. To calculate the CAGR of an investment one divides the value at the end of the investment period by its value at the beginning of that period. Then raise the result to an exponent of one divided by the number of years, and subtract one from the subsequent result.
As an example, consider an investor who has invested $1,000 in a particular fund, which is then worth $1,850 after three years. In absolute terms, the fund has nearly doubled the initial stake in generating a return of 85% over the three years. However, this can be misleading and is a case where applying CAGR is a useful exercise. By applying CAGR: (1850/1000)^(1/3) – 1, one gets 23%. In other words, the investment in the fund has yielded an average return of 23% every year over the last three years. This is the compounded return earned on an annual basis irrespective of the individual yearly performances of the fund.
CAGR vs Internal Rate of Return
The Internal Rate of Return (IRR) is also an important tool to calculate returns from an investment. However, it is often more complex to calculate and more useful in more difficult situations comprising many factors. These situations may involve multiple cash inflow and outflow events that are not possible to calculate using the CAGR. Put another way, while CAGR is easier to calculate, IRR can cope with more complicated situations. The calculation of IRR makes use of the time period of the investment and the cash flows over that time period. To do so, the investor needs to calculate the discount rate or the IRR at which the Net Present Value of the investment becomes zero.
What Is Risk-Adjusted CAGR?
To compare the performance and risk characteristics among various investment alternatives, investors can use a risk-adjusted CAGR. A simple method for calculating risk-adjusted CAGR is to multiply the CAGR by one minus the investment’s standard deviation. If the standard deviation (the amount of risk) is zero, then the risk-adjusted CAGR is unaffected. The larger the standard deviation, the lower the risk-adjusted CAGR will be.
Can you calculate CAGR using a spreadsheet?
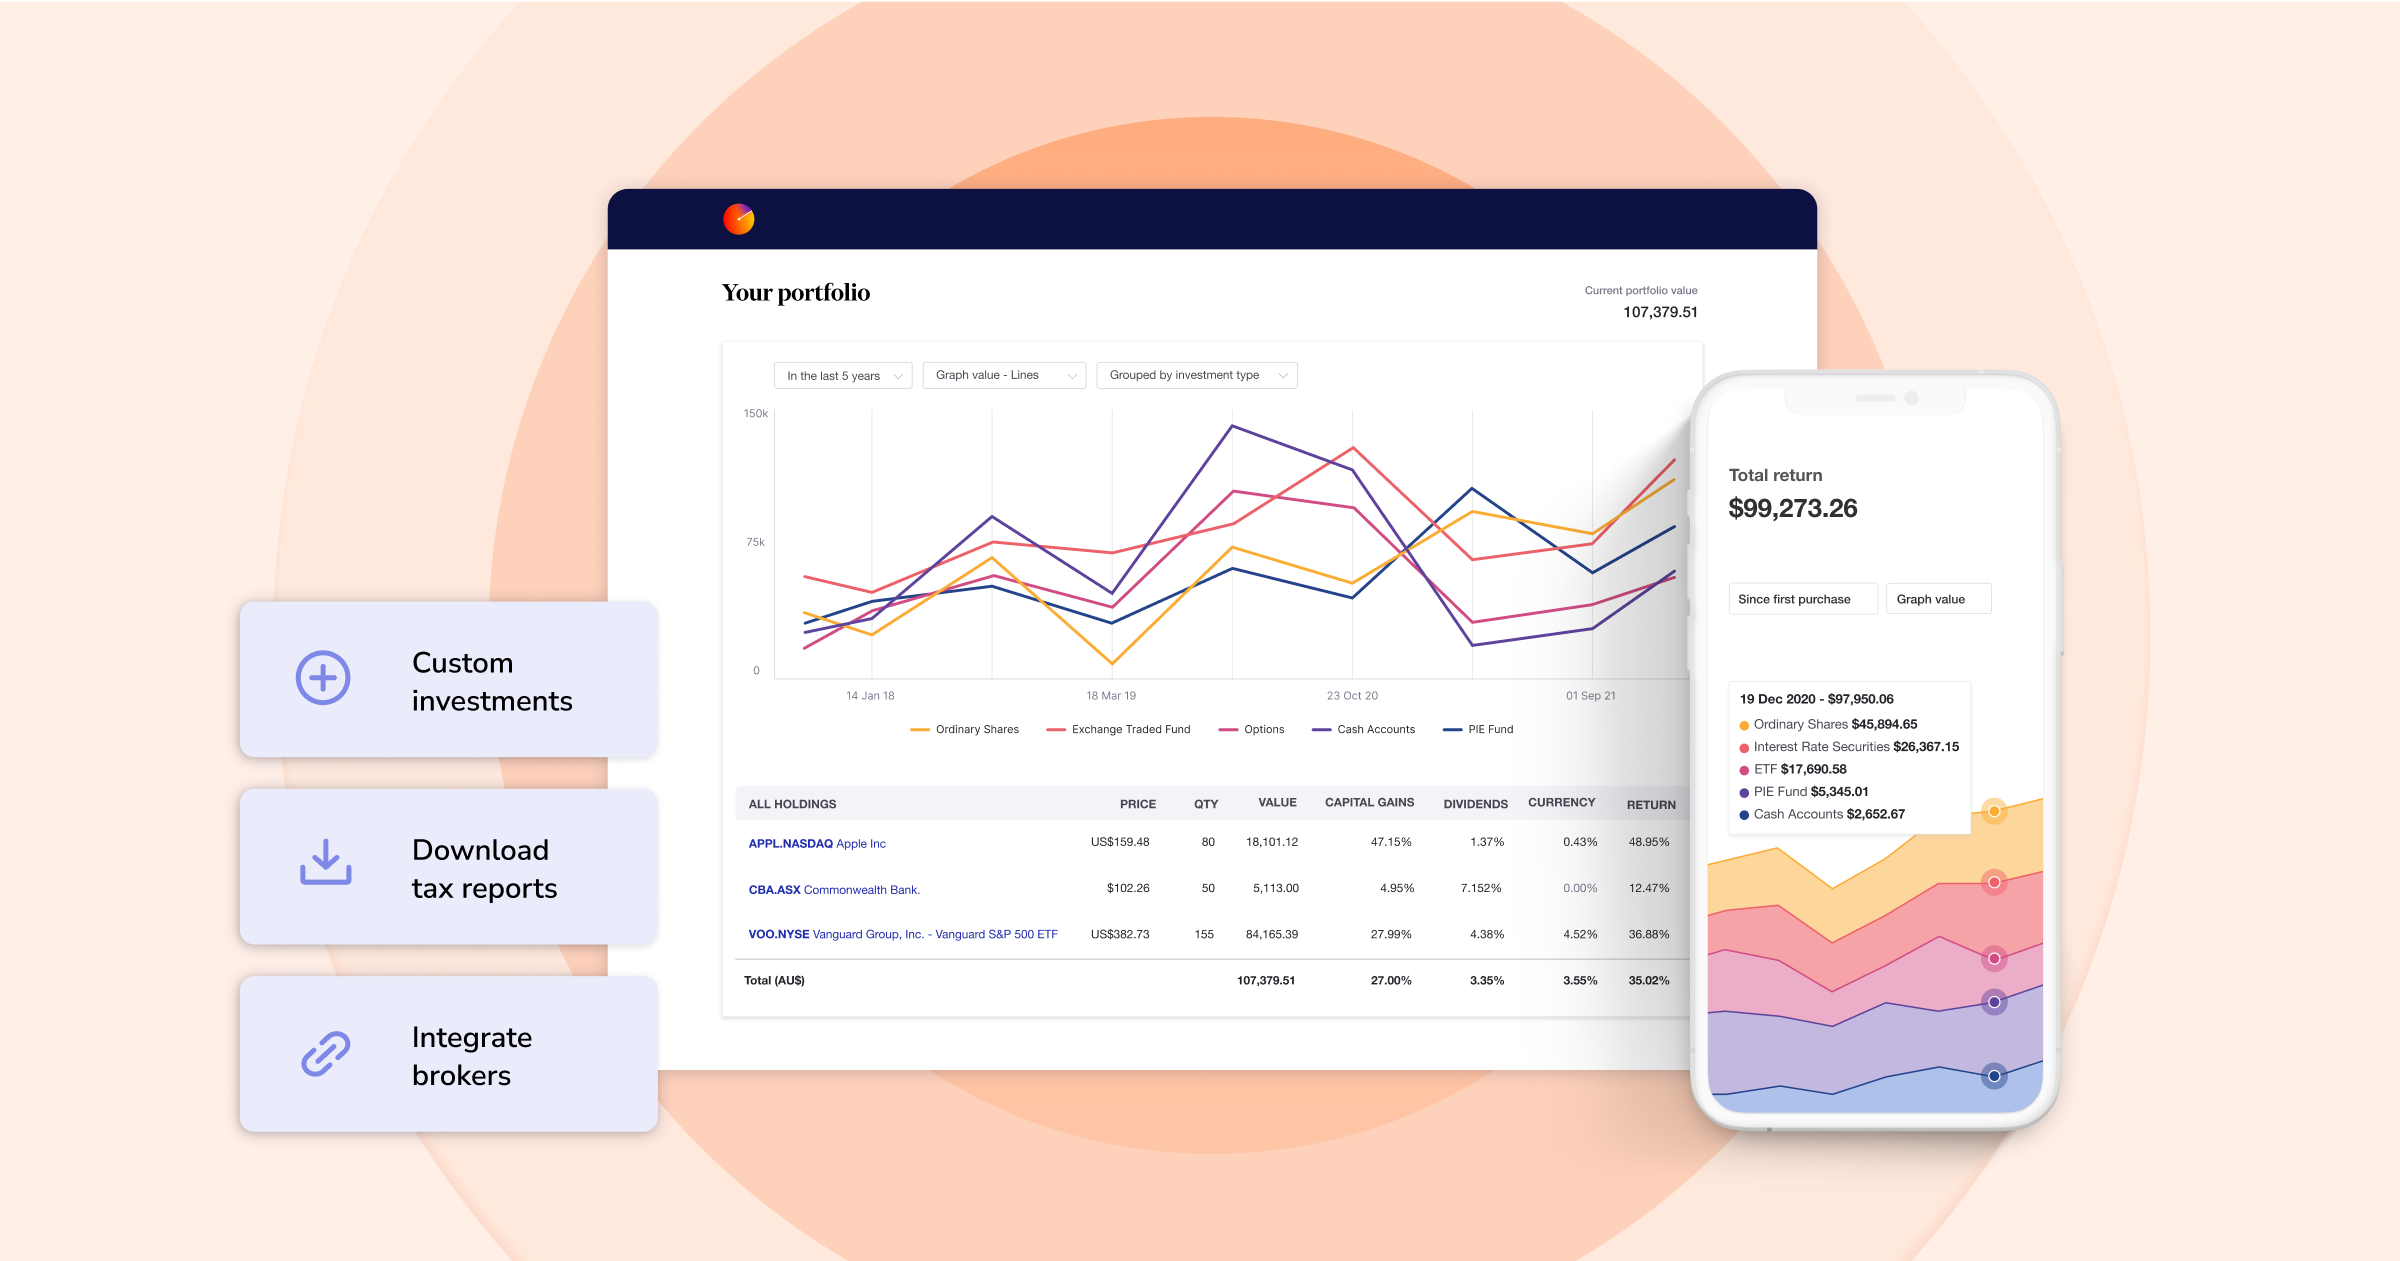
It’s possible to calculate CAGR using a spreadsheet, however there is no built-in CAGR formula and you will need to set this up yourself, manually adding your data every time you want to calculate CAGR under a different scenario. By using an automated online portfolio tracker like Sharesight, you can easily compare the performance of your shares over different time periods.
For example, Sharesight users have the option to set their portfolio’s annualised performance calculation method to ‘simple’ or ‘compound’. This means that users can choose whether their returns are calculated based on the principles of a simple annualised return or by using a compound annual growth rate (CAGR), along with the time period over which investment performance is calculated. Calculating the CAGR of your investments is also made easier than ever with Sharesight’s ability to automatically track all of your investments in one place, eliminating the need for manual data entry and complex spreadsheets.
Calculate your investment returns with Sharesight
Thousands of investors around the world are using Sharesight to automatically calculate their investment portfolio returns. If you’re not already using Sharesight, what are you waiting for? Sign up for a Sharesight account so you can:
-
Track all your investments in one place, including over 240,000 global stocks, ETFs, mutual/managed funds, property and even cryptocurrency
-
Run powerful reports built for investors, including Performance, Portfolio Diversity, Contribution Analysis, Multi-Period and Multi-Currency Valuation
-
See the true picture of your investment performance, including the impact of brokerage fees, dividends, and capital gains with Sharesight’s annualised performance calculation methodology
-
Easily share access to your portfolio with family members, your accountant or other financial professionals so they can see the same picture of your investments that you do.
Sign up for a FREE Sharesight account and get started tracking your investment performance (and tax) today.

Disclaimer: The above article is for informational purposes only and does not constitute a specific product recommendation, or taxation or financial advice and should not be relied upon as such. While we use reasonable endeavours to keep the information up-to-date, we make no representation that any information is accurate or up-to-date. If you choose to make use of the content in this article, you do so at your own risk. To the extent permitted by law, we do not assume any responsibility or liability arising from or connected with your use or reliance on the content on our site. Please check with your adviser or accountant to obtain the correct advice for your situation.
FURTHER READING

Prepare your annual accounts with our historical cost report
Sharesight's historical cost report is a powerful tool for investors who need to prepare annual accounts or financial statements with mark-to-market accounting.

Sharesight product updates – July 2025
This month's focus was on rolling out predictive income forecasting, as well as improved cash account syncing across different brokers and currencies.

5 ways Sharesight helps Australian investors at tax time
Learn how Sharesight’s Australian tax features can not only help you complete your tax return, but also save you time and money at tax time.