Calculate your investment portfolio diversification with Sharesight
A common strategy for investors looking to safeguard their assets against risk, investment portfolio diversification is especially important for long-term investors or those investing for retirement, who have a higher likelihood of being exposed to market corrections or other economic events. While many investors think their portfolio is diversified, they often overestimate their diversity due to a lack of clarity around what their asset allocation is and how to calculate investment portfolio diversity. Using an asset allocation calculator like Sharesight’s diversity report is one easy way for investors to determine their asset allocation, giving them the information they need to make informed decisions and rebalance their portfolio as needed.

Why does investment portfolio diversification matter?
Investment diversification seeks to lower correlation risk across a basket of assets in an investment portfolio to mitigate the risk of a single event impacting the portfolio’s returns. In other words, investing across different sectors, asset classes and markets can be a good way to minimise correlation between assets and reduce losses in the event of a market correction impacting a particular sector or asset class.
How to calculate investment diversification
There are many different ways to group a portfolio’s investments in order to calculate the portfolio’s asset allocation or level of diversification. For example, investors may choose to determine their portfolio’s diversity by market, currency, sector, industry, investment type, country, or a custom grouping based on investment attributes of their choice.
Calculate your portfolio’s investment diversity with Sharesight
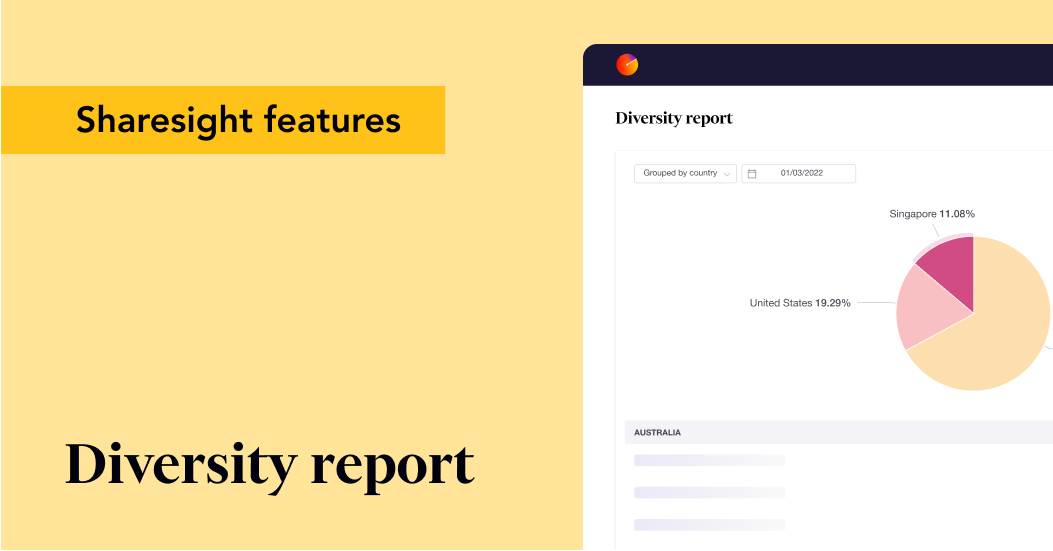
It’s easy to calculate your investment diversity with Sharesight’s diversity report, which provides investors with a breakdown of their portfolio’s asset allocation based on the classifications of their choice. To learn more about how the report gives investors an accurate view of their portfolio’s diversity, keep reading.
Calculate the asset allocation of your portfolio
The report gives investors a breakdown of their asset allocation in each category, expressed in both percentage and cash values – making it easy to see exactly how much a portfolio’s holdings are weighted towards each asset class. This makes it easy for investors to track their asset allocation throughout the year and rebalance their portfolio according to their asset allocation target.
The screenshot below, for example, shows the diversity report being used to determine a portfolio’s asset allocation by investment type, where it comprises 42.21% cash, 36.06% ordinary shares, 10.79% managed funds, 9.72% ETFs and 1.21% preference shares. If the investor in question was targeting greater diversity in their asset classes, they may decide that they are overweight in ordinary shares and underweight in cash, or they might consider investing in an additional asset class such as property, for instance.
The diversity report used for a portfolio of global investments, classified by investment type.
Track portfolio diversification using the dimensions of your choice
Sharesight’s custom groups feature can be used with the diversity report to define asset allocation by the dimensions of your choice. This is useful for investors who need an easy way to calculate portfolio diversification based on their unique risk profile and collection of assets. The screenshot below, for example, shows the feature being used to differentiate between different types of stocks and ETFs, while also highlighting mutual funds and cryptocurrency investments.
A portfolio using the custom groups feature to highlight various types of stocks, ETFs, mutual funds and cryptocurrency.
Note: For Sharesight users with multiple portfolios, it is also possible to view your asset allocation across all of your investments by creating a consolidated view.
Compare your asset allocation over different periods
The diversity report allows investors to view their asset allocation on any date of their choice. This is useful for investors who want to compare their asset allocation from one period to the next, or use the information to prepare financial statements such as asset allocation and investing strategy reports for their SMSF or any other self-managed pension fund.
Track against your asset allocation strategy with your financial adviser
Another convenient feature of the diversity report is the ability to export this data to share it with your financial adviser, giving them the information they need to track your investments against your asset allocation strategy. To make this easier, Sharesight allows you to export the report to different file formats such as Google Sheets, an XLS spreadsheet or PDF file.
Calculate more than just your investment diversification with Sharesight’s portfolio tracker
Thousands of global investors are using Sharesight to simplify their tax reporting and discover the true performance of their investments. What are you waiting for? Sign up today and:
-
Track all of your investments in one place, with the ability to track over 500,000 stocks, ETFs, trusts and managed/mutual funds, as well as property, cash accounts and cryptocurrency
-
Automatically track your dividend and distribution income from stocks, ETFs, trusts and managed/mutual funds
-
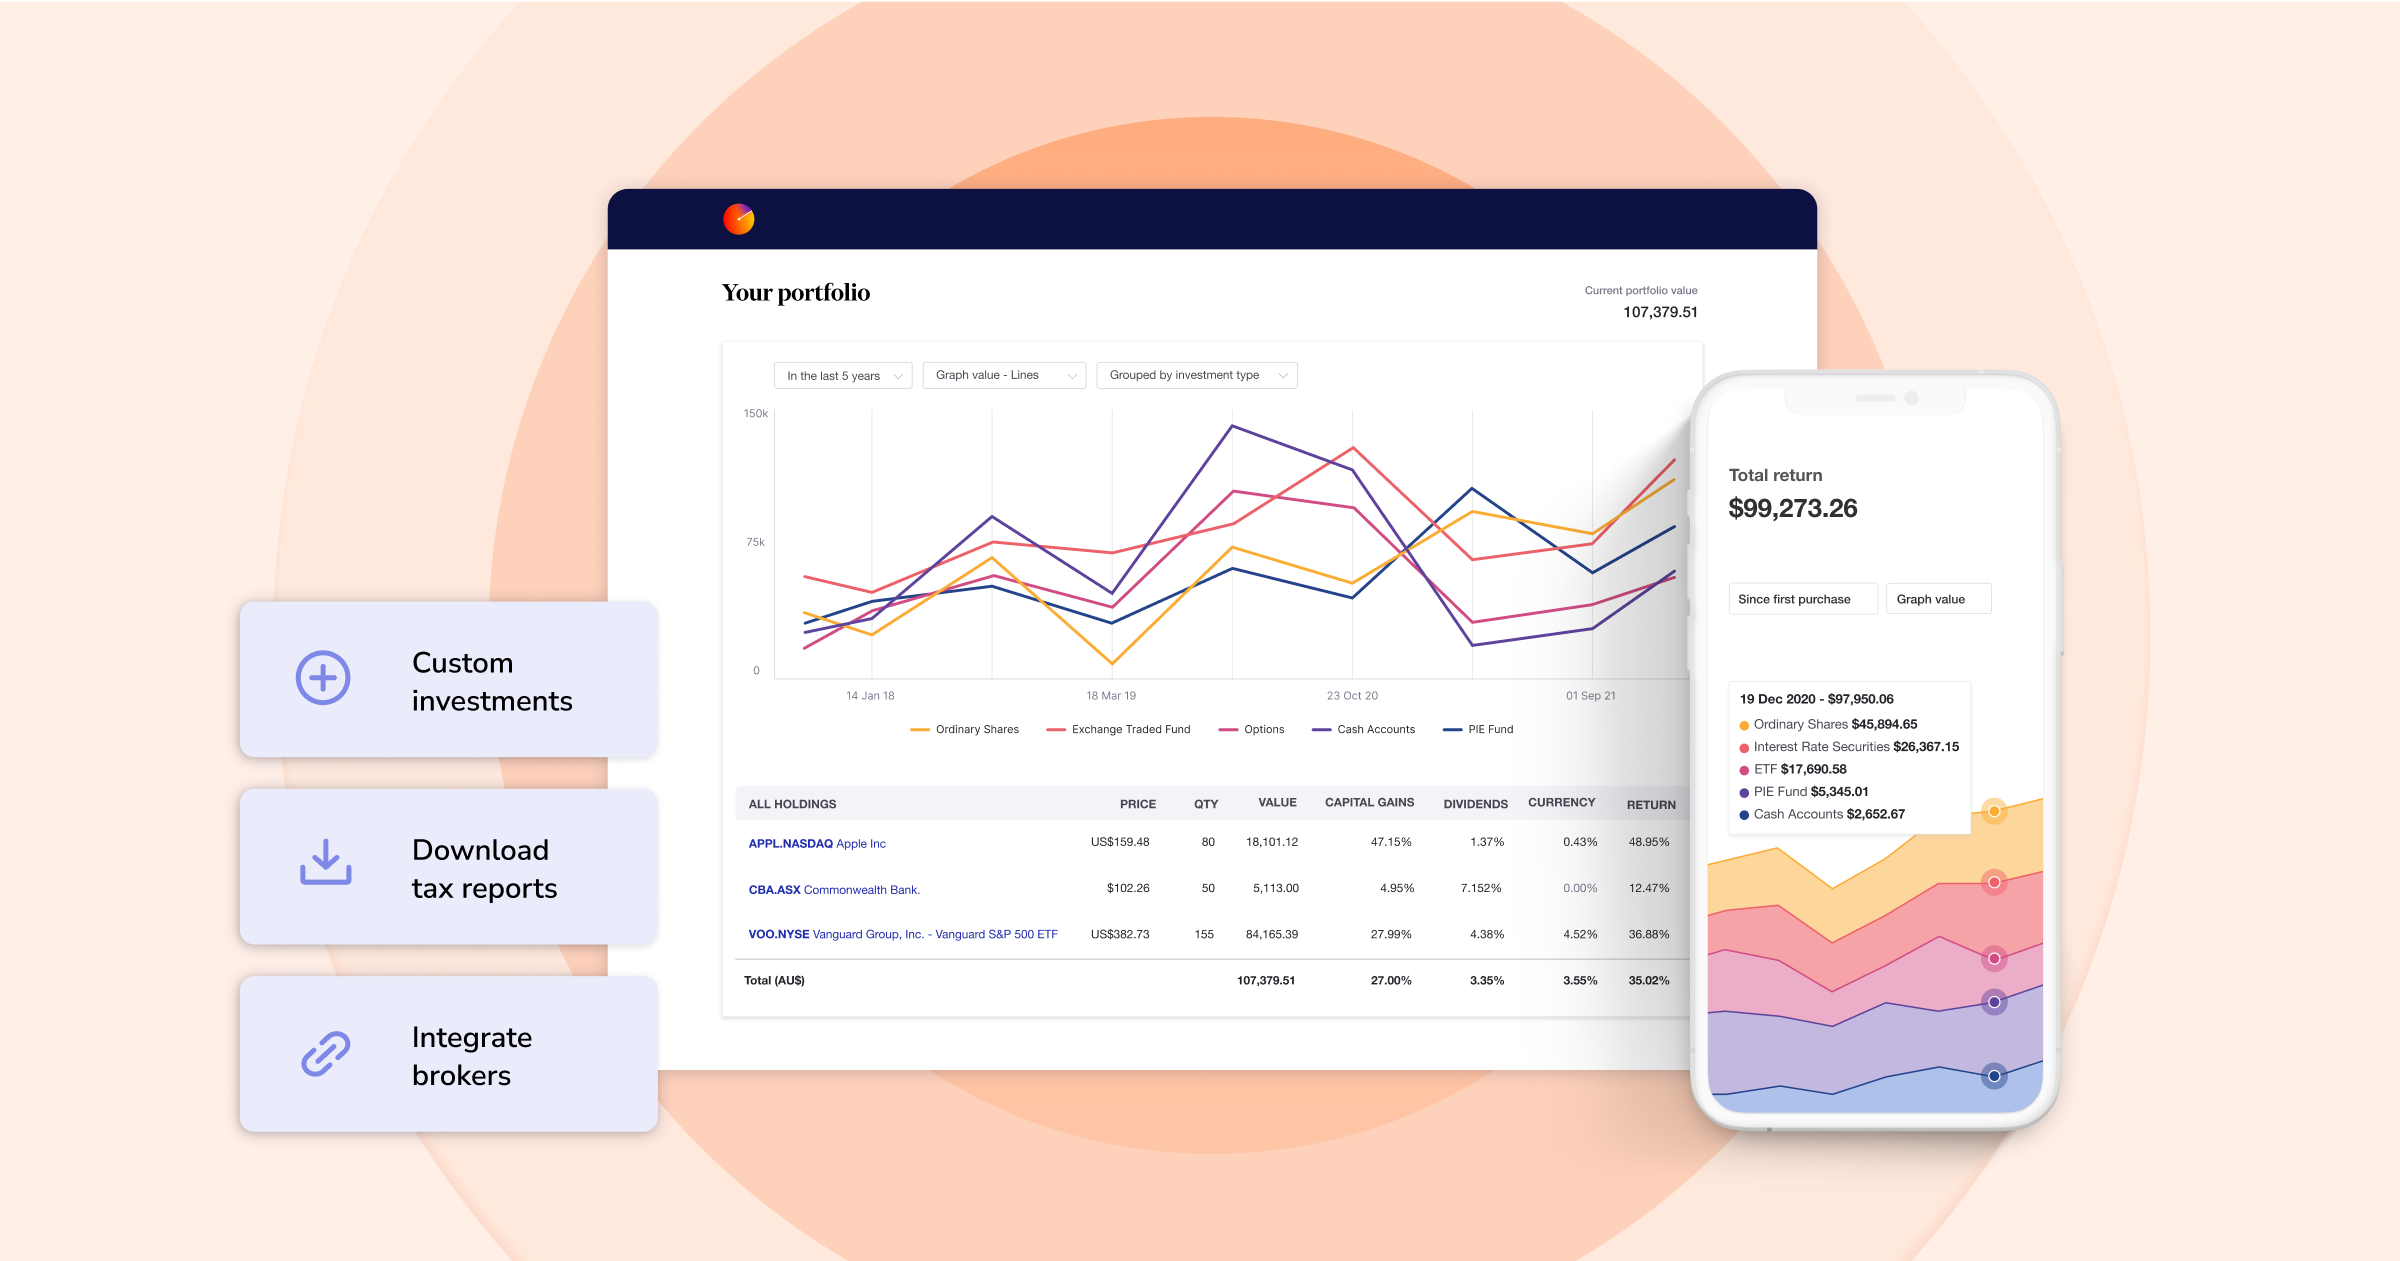
Run powerful reports built for investors, such as performance, portfolio diversity, contribution analysis, multi-currency valuation and future income (upcoming dividends)
-
Easily share access of your portfolio with family members, your accountant or other financial professionals so they can see the same picture of your investments as you do
Sign up for a FREE Sharesight account and get started tracking your investment performance (and tax) today.

FURTHER READING

You can time the market – and ETFs are the way to do it
Marcus Today founder and director Marcus Padley discusses timing the market, and how investors can do this using exchange-traded funds (ETFs).

Morningstar analyses Australian investors’ top trades: Q1 2025
Morningstar reviews the top 20 trades by Australian Sharesight users in Q1 2025, and reveals where their analysts see potential opportunities.

Sharesight product updates – April 2025
This month's focus was on improving cash account syncing, revamping the future income report and enabling Apple login functionality.