How to calculate cost base per share
The cost base of an investment is one of the key metrics an investor needs to know when preparing their tax return. While it is possible to manually calculate the cost base of your investments, this quickly becomes tedious and subject to error, especially for large portfolios with a lot of trades and dividend-paying stocks. To learn more about cost base per share, how it’s calculated and how you can automatically track it using Sharesight, keep reading.

What is cost base per share?
The cost base of an investment is its original value for tax purposes – typically the value of the purchase price adjusted for corporate actions such as stock splits, dividends and return of capital distributions. It can also include any fees that were involved in the purchase. Cost base is used to determine an investment’s capital gain, which is calculated based on the difference between the investment’s cost base and the current market value. It is important to know the cost base (and capital gain) of your stocks, especially if you have sold shares, as this can have tax implications. The cost base per share is simply an investment’s cost base divided by the number of shares.
How is cost base per share calculated?
There are different ways to calculate cost base per share depending on the corporate action involved. To calculate cost base per share for a company that has undergone a stock split, consider the following example:
You hold 500 shares in the company, which were purchased at a price of $10/share. The company undergoes a 2:1 stock split. To figure out your cost base per share, you will need to divide the original value of the investment ($5,000) by the new number of shares you hold post-split (1,000) to get a value of $5, compared to your previous cost base per share of $10. You could also divide your original cost base per share ($10) by the split factor of 2:1, which would give you the same result.
This is just one example, however in most cases you will need to undertake further calculations if you want to adjust your cost base for dividends and distributions or for additional share parcel purchases or sales, for instance. If you have a large portfolio or a lot of dividend-paying stocks, this can become tedious and subject to error.
View cost base per share at a glance
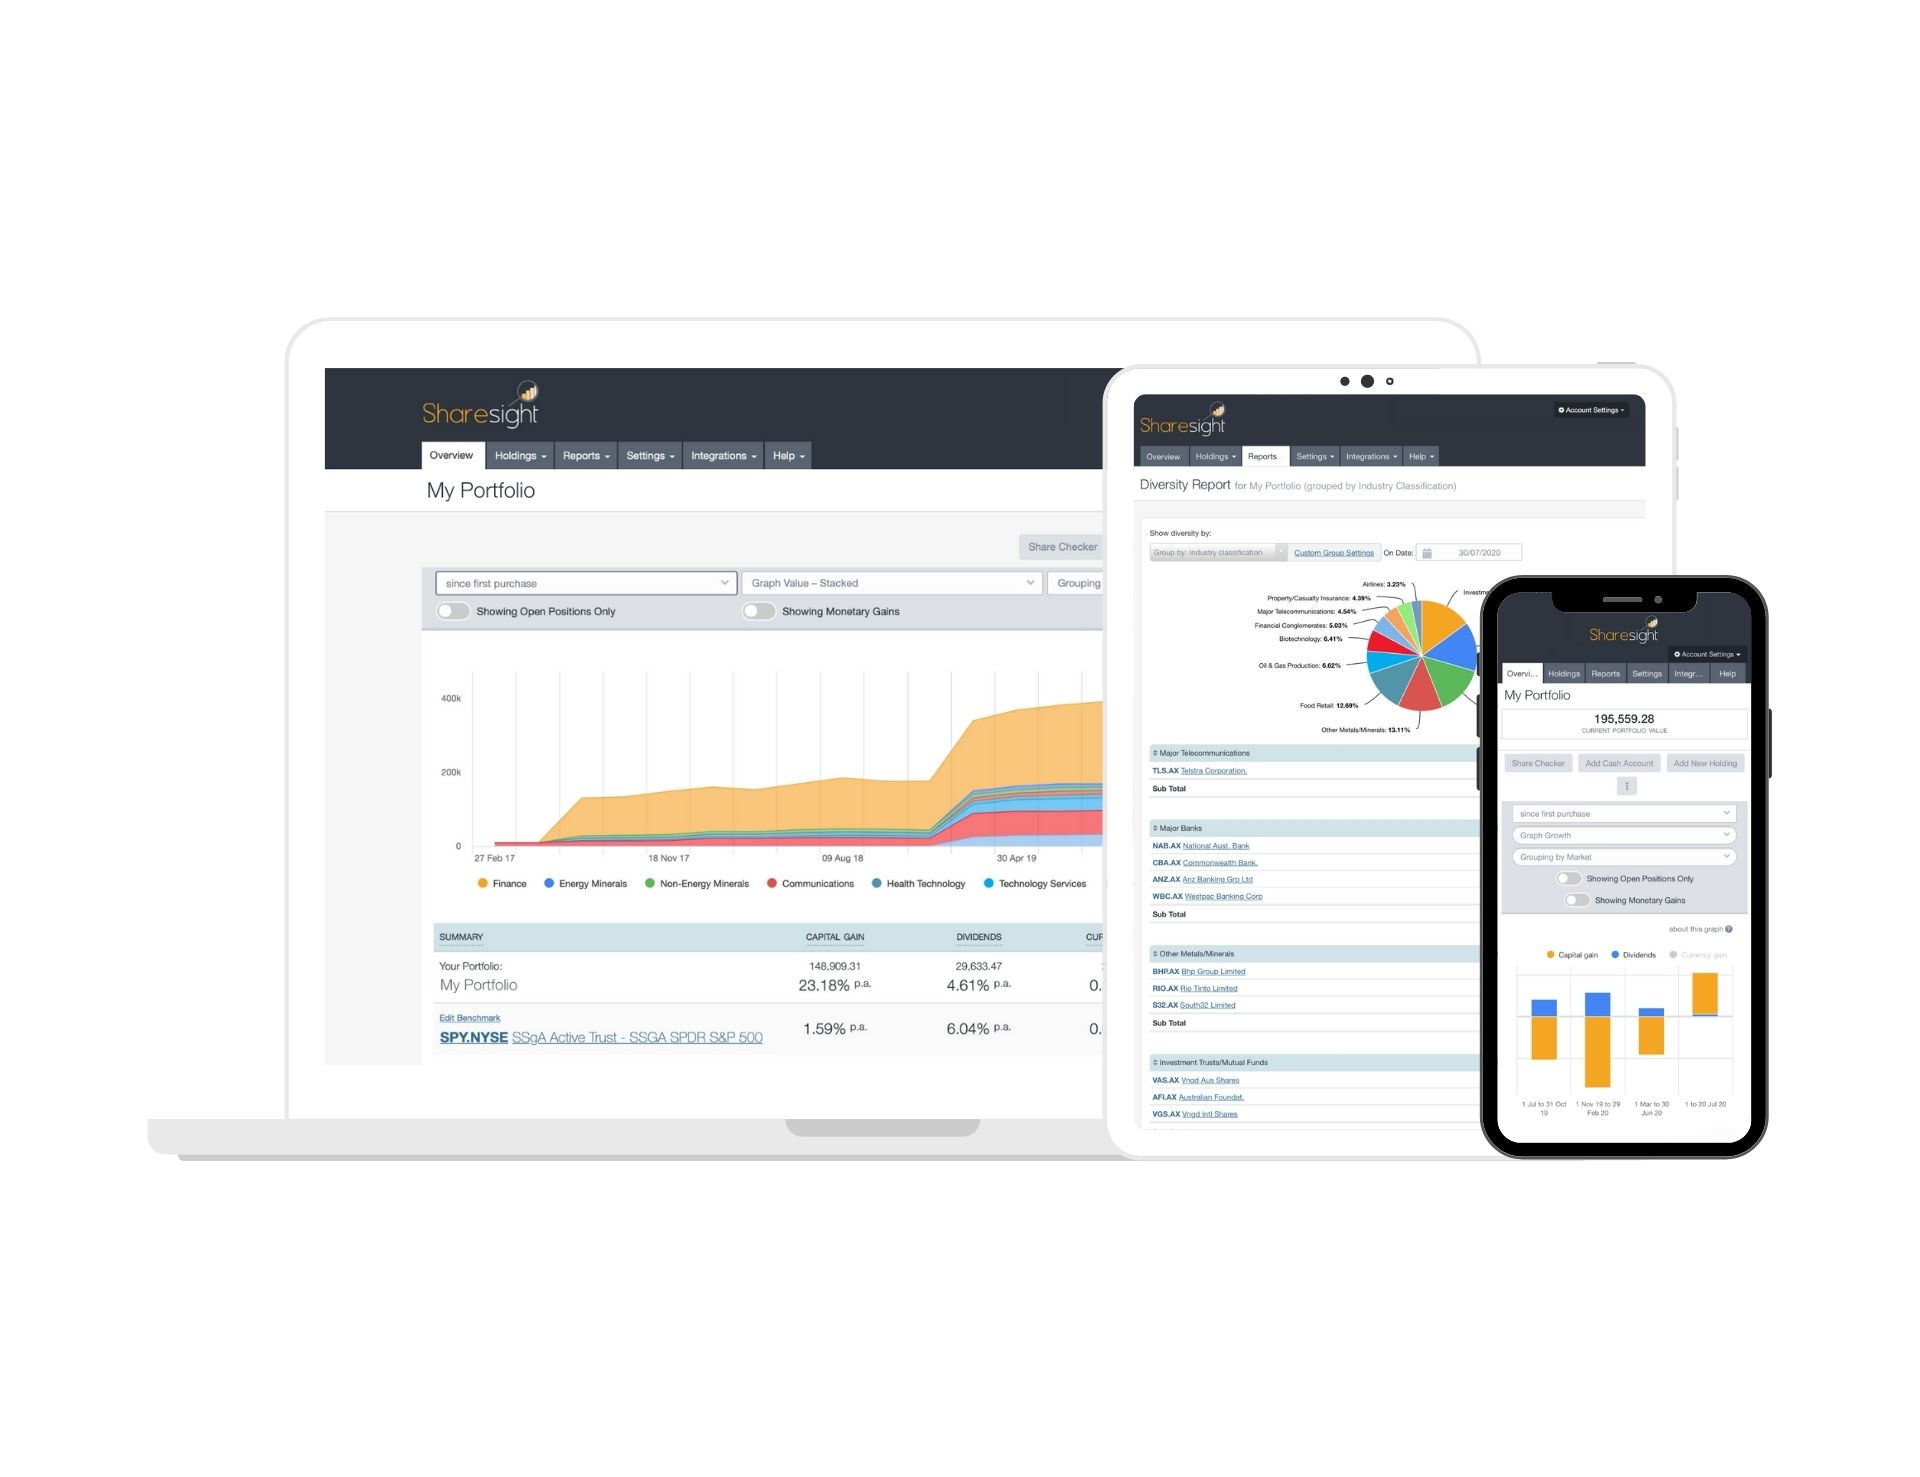
With Sharesight, the cost base of your investments is automatically tracked and updated as corporate actions and trades occur. To find the cost base of an investment, simply click into the relevant holding in your portfolio and open the ‘Holding Information’ tab. Here you can view the investment’s current value, quantity of shares, cost base and cost base per share.

An example of cost base information for a European stock in a UK portfolio. The value is shown in British Pounds and Euros, while cost base is shown in the currency of the portfolio’s Tax Residency.
Track your investment performance with Sharesight
Thousands of investors around the world are using Sharesight to automatically calculate their investment portfolio returns. If you’re not already using Sharesight, what are you waiting for? Sign up for a Sharesight account so you can:
-
Track all your investments in one place, including over 240,000 global stocks, ETFs, mutual/managed funds, property and even cryptocurrency
-
Run powerful reports built for investors, including Performance, Portfolio Diversity, Contribution Analysis, Multi-Period and Multi-Currency Valuation
-
See the true picture of your investment performance, including the impact of brokerage fees, dividends, and capital gains with Sharesight’s annualised performance calculation methodology
-
Easily share access to your portfolio with family members, your accountant or other financial professionals so they can see the same picture of your investments that you do.
Sign up for a FREE Sharesight account and get started tracking your investment performance (and tax) today.

Disclaimer: The above article is for informational purposes only and does not constitute a specific product recommendation, or taxation or financial advice and should not be relied upon as such. While we use reasonable endeavours to keep the information up-to-date, we make no representation that any information is accurate or up-to-date. If you choose to make use of the content in this article, you do so at your own risk. To the extent permitted by law, we do not assume any responsibility or liability arising from or connected with your use or reliance on the content on our site. Please check with your adviser or accountant to obtain the correct advice for your situation.
FURTHER READING

8 ways to use Sharesight's custom groups feature
This blog explains our custom groups feature, including strategies that can help you gain deeper portfolio insights and make more informed investing decisions.

You can time the market – and ETFs are the way to do it
Marcus Today founder and director Marcus Padley discusses timing the market, and how investors can do this using exchange-traded funds (ETFs).

Morningstar analyses Australian investors’ top trades: Q1 2025
Morningstar reviews the top 20 trades by Australian Sharesight users in Q1 2025, and reveals where their analysts see potential opportunities.